

Why the inflation shock has once again raised questions about the sustainability of the AI boom
On October 14, 2026, the U.S. Bureau of Labor Statistics (BLS) reported an acceleration in annual consumer inflation to 3.7% from 3.4% in August. The Consumer Price Index (CPI) rose by 0.6% for the month, with gasoline prices jumping by 9.1%, accounting for more than half of the monthly increase in the overall index. Core inflation, excluding food and energy, reached 2.6% year-over-year.
The figures published in the official BLS report for September 2026 indicate persistent price pressures. The energy index rose by 5.2% for the month and 20.4% for the year. For the Federal Reserve, this means assessing how prolonged the impact of expensive energy will be on inflation and consumer demand.
For tech companies, the consequences extend beyond ordinary stock index fluctuations. Rising inflation can alter expectations regarding the Fed's monetary policy, government bond yields, and corporate borrowing costs. If investors expect rates to remain high for longer, future cash flows of companies are discounted at a higher rate, reducing the attractiveness of long-term investment projects.
Companies that need to invest significant funds today to start reaping full returns in a few years are particularly sensitive to such changes. This characteristic unites many AI infrastructure operators, although their financial positions vary significantly.
Unlike the mature software business, where an additional client can often be served with relatively low marginal costs, building an AI data center requires substantial initial investments. Equipment must be purchased, installed, and connected to power before it starts generating revenue. Meanwhile, payments on loans, leases, and energy contracts may arise regardless of actual capacity utilization.
However, it is important to distinguish between two effects here. High rates do not necessarily worsen the current profitability of all tech companies: firms with large cash reserves and stable operational flows can continue to invest without significant borrowing. For operators dependent on external financing, the same macroeconomic conditions can become a much more serious constraint.
Thus, the main issue with the AI boom is not that investments are large, but how quickly they turn into cash flow and how the financial burden is distributed among market participants.
Where trillion-dollar investments in artificial intelligence are headed
The scale of investments in AI infrastructure is already comparable to the investment programs of the largest sectors of the global economy. According to the April Global Financial Stability Report, the IMF estimates AI-related capital expenditures of major cloud companies at approximately $3.4 trillion by the end of 2029. In the report's appendix, the projected total CapEx for a sample of ten hyperscalers for 2026–2029 is about $3 trillion. These figures cannot be mechanically summed: they refer to similar but not entirely identical calculations.
The same IMF study notes that since January 2025, the largest hyperscalers have raised over $100 billion through bond financing. The fund emphasizes that the creditworthiness of major tech companies remains high overall due to strong balance sheets and the ability to generate cash flow.
The scale of the investment cycle is also evidenced by estimates from the International Energy Agency (IEA). According to its assessment, capital expenditures of the largest tech companies exceeded $400 billion in 2025. In 2026, the agency expects them to increase by approximately 75% more. The IEA separately notes that the investments of just five tech companies already exceed the global investment volume in oil and natural gas extraction.
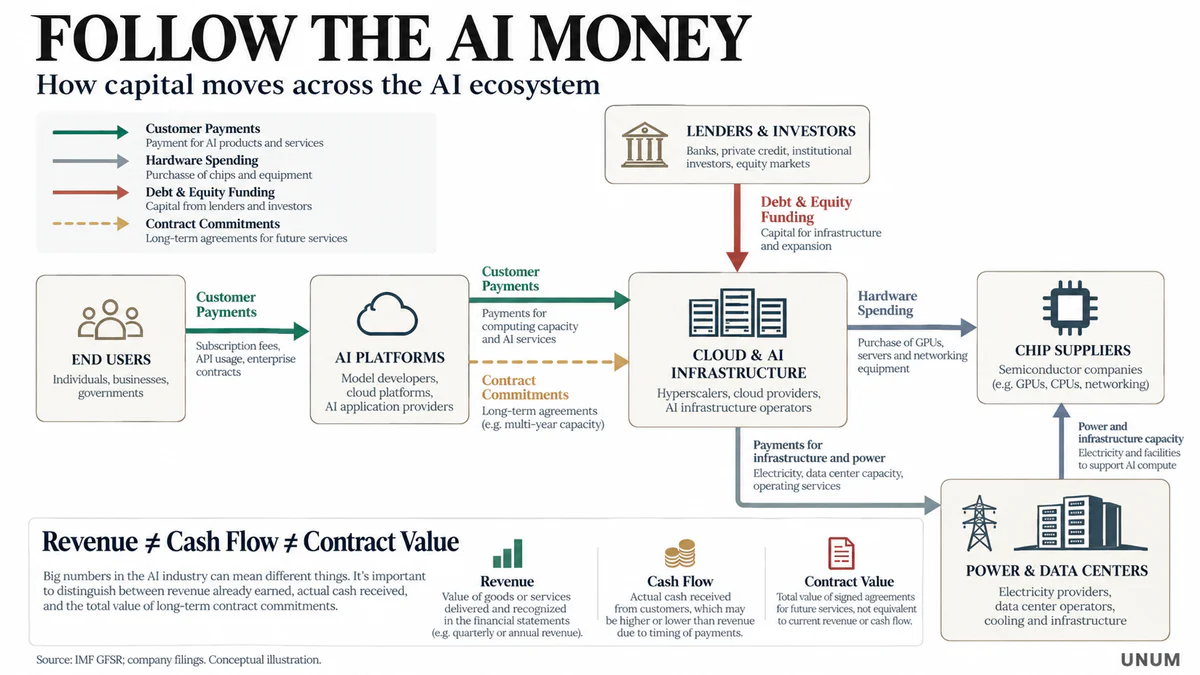
However, the term "investments in AI" encompasses several different economic processes. To understand financial risks, it is necessary to divide the market into sequential levels.
First level — equipment manufacturing. Nvidia and AMD develop accelerators, TSMC produces advanced semiconductors, and ASML supplies lithographic systems necessary for their production. These companies receive revenue from customers expanding their computing power.
Second level — cloud platforms. Microsoft, Amazon, and Alphabet purchase equipment, build data centers, and provide computing resources to their own divisions, developers, and corporate clients.
Third level — specialized AI infrastructure operators. Oracle, CoreWeave, and Nebius develop computing power using various combinations of their own funds, debt, leasing, and client contract payments.
Fourth level — model developers and end users. This is where the demand for AI training and application is formed, which ultimately determines the profitability of the entire technological chain.
Fifth level — infrastructural. It encompasses energy, construction, cooling, network equipment, and power supply systems. Without these components, even purchased GPUs cannot be turned into working computing power.
At the same time, financial relationships between participants are not always linear. A company can simultaneously finance an AI developer, supply them with infrastructure, purchase their services, and enter into long-term agreements for the use of computing. Such connections can support growth but complicate the assessment of independent market demand and the distribution of financial risks.
This is why the total volume of investment commitments cannot be automatically equated to either the future revenue of the AI industry or the amount of expenses already incurred.
Why chip manufacturers become the main financial beneficiaries
One of the features of the current investment cycle is the differences between companies supplying equipment and those using it to provide services.
An accelerator manufacturer receives revenue from equipment sales, while a data center operator must gradually recoup investments through the loading of computing power. The difference in cash flow timing explains why high demand for AI can be accompanied by record profitability for suppliers and negative free cash flow for some of their clients.
Nvidia achieves record revenue from computing demand
In August, Nvidia announced the results for the second quarter of fiscal 2027, ending July 26, 2026. Quarterly revenue reached $96.2 billion, up 106% year-over-year, with the Data Center division bringing in $89 billion — 117% more than the previous year.
GAAP gross margin was 75%, and operating profit was $63.7 billion. The company also forecasted next quarter's revenue at around $108 billion with a permissible deviation of 2%.
Nvidia founder and CEO Jensen Huang articulated the change in industry economics in an official release as follows:
Now computing is revenue.
The statement reflects the company's central investment hypothesis: computing power is no longer just technological infrastructure but becomes an independent commercial resource.
To assess Nvidia's stock prospects, it is important to consider not only the growth in GPU sales but also the financial capabilities of equipment buyers. GPU sales generate revenue for the manufacturer now, while the economic result for the customer depends on future computing prices, server load, electricity costs, and equipment lifespan.
Moreover, rapid production expansion creates the risk of cyclicality. If major customers reduce capital programs, begin to use existing accelerators more efficiently, or accelerate the transition to their own chips, revenue growth rates for suppliers may change even with sustained long-term AI demand.
TSMC demonstrates high production profitability
Results from Taiwan Semiconductor Manufacturing Company for the third quarter of 2026 confirm that demand for advanced semiconductors remains strong.
On October 15, the company reported revenue of NT$1.494 trillion, or approximately $46.72 billion, with a net profit of NT$763.06 billion. Annual revenue growth was 50.9% in new Taiwan dollars, and net profit increased by 68.7%.
Gross margin reached 66.4%, and operating margin was 58.7%. Technological processes of 7 nanometers and more advanced accounted for 79% of wafer production revenue, including 33% for three-nanometer and 8% for two-nanometer technologies.
These indicators point to a high demand for advanced technological processes; however, to assess the actual utilization of production capacities, it is necessary to additionally consider the output volume and available production capacity. Secondly, they demonstrate the company's ability to maintain high profitability even amid large-scale capacity expansion.
Nevertheless, semiconductor manufacturing is capital-intensive. New factories require years of investment, and equipment utilization depends on future orders. To assess TSMC's sustainability, it is necessary to consider not only quarterly profits but also capital expenditures, production launch timelines, depreciation, and potential changes in demand for advanced processes.
ASML sees demand for equipment until the end of the decade
On October 14, ASML reported revenue of €11.66 billion and net profit of €4.96 billion for the third quarter of 2026. The gross margin reached 57.5%, and the number of new lithography systems sold increased from 86 in the second quarter to 113 in the third quarter.
The company expects revenue for the entire year 2026 to be in the range of €44–45 billion and acknowledges that current expansion plans for 2027–2028 may not be sufficient to meet customer needs.
ASML CEO Christophe Fouquet noted:
Our clients continue to raise their short-term and medium-term demand forecasts for equipment, which they provide to us.
According to ASML management, some clients express interest in placing orders for delivery in 2029–2030, but such interest does not yet mean firm contracts are concluded.
Thus, the reports from Nvidia, TSMC, and ASML provide strong arguments against the claim that the entire AI boom is based solely on speculative expectations. The demand for equipment is confirmed by actual sales, orders, and profits. However, these data primarily characterize the current phase of the investment cycle, not the guaranteed payback of all projects for which the equipment is purchased.
Hyperscalers between record revenue and capital expenditures
The financial situation of the largest cloud companies is more complex, as they simultaneously develop AI infrastructure and generate income from numerous existing areas.
Microsoft, Alphabet, Amazon, and Meta have substantial sources of operating cash flow, but investments in AI are increasingly impacting the amount of free cash flow remaining after capital expenditures.
For analysis, the free cash flow (FCF) indicator is fundamentally important. In its basic interpretation, it represents operating cash flow (OCF) minus cash capital expenditures. However, definitions of FCF may vary among companies, especially regarding the accounting of financial leases and proceeds from equipment sales.
Negative FCF does not necessarily indicate a loss-making business. It may arise from intensive infrastructure expansion. However, for investors, it is important to understand how long a company can sustain investment spending and what sources of financing will be necessary if current cash flows are insufficient.
Microsoft retains the ability to finance growth with its own funds
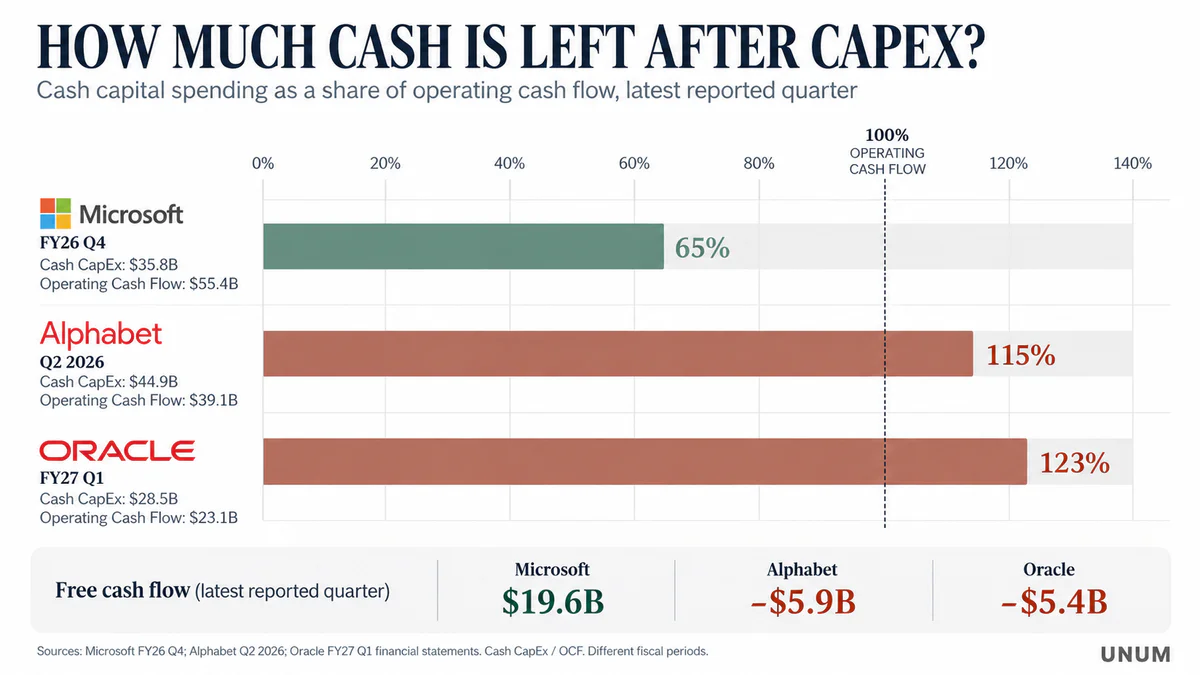
In the fourth quarter of fiscal 2026, Microsoft reported that total CapEx reached about $41 billion, including financial leases. Direct cash payments for fixed assets amounted to $35.8 billion, and the volume of financial leases was about $5.6 billion. About two-thirds of this amount was for assets with relatively short useful lives, primarily processors and GPUs.
Operating cash flow for the quarter was $55.4 billion, and free cash flow was $19.6 billion. The difference between total CapEx and the amount of cash capital expenditures is explained, in particular, by the inclusion of financial leases: cash payments for fixed assets amounted to about $35.8 billion.
Microsoft Cloud revenue for the fourth quarter of FY2026 was $59.3 billion. Commercial RPO reached $678 billion, including obligations under agreements with OpenAI. The company expects to recognize about 30% of this amount as revenue over the next 12 months.
A feature of Microsoft is that funding for AI infrastructure is supported by a wide range of profitable areas, including corporate software, cloud services, and subscriptions. This reduces the company's dependence on individual projects, although it does not eliminate the risk of reduced returns on new investments.
Meta directs a significant portion of cash flows to AI development
In the second quarter of 2026, Meta reported $60.8 billion in revenue and $31.86 billion in operating cash flow. Capital expenditures, including principal payments on financial leases, amounted to $31.08 billion, and free cash flow decreased to $784 million from $8.55 billion a year earlier.
For the entire year 2026, Meta forecasted capital expenditures in the range of $130–145 billion.
This means that the free cash flow for the reporting quarter was approximately 1.3% of revenue, even though operating activities remained profitable.
At the same time, Meta's investments cannot be evaluated solely through cloud computing sales. AI is used to enhance the efficiency of advertising algorithms, recommendations, and user products, so part of the economic result is reflected in the development of the existing business rather than in a separate 'AI revenue' line item.
To assess the return on Meta's investments, it is necessary to examine the dynamics of advertising revenue, operating margin, monetization efficiency, and capital expenditures simultaneously.
Amazon expands AWS despite negative FCF
Amazon also demonstrates the difference between the growth of the cloud business and the current cash flows of the entire group.
In the second quarter of 2026, Amazon Web Services revenue increased by 37%, reaching $42.2 billion, while the segment's operating profit was $16.6 billion.
At the same time, Amazon's free cash flow over the past 12 months was negative, amounting to −$7.6 billion. The company attributed the change primarily to a significant increase in capital investments, including those related to artificial intelligence.
Amazon's net income, which reached $62.6 billion for the quarter, requires special attention. This figure includes a significant non-operational effect from the revaluation of investments, primarily related to Anthropic. Therefore, using such profit as a direct measure of AI infrastructure profitability would be incorrect.
For fundamental analysis, more informative metrics are AWS's operating profit, free cash flow, CapEx dynamics, and the volume of actual cloud services provided.
Alphabet illustrates how much accounting profit can differ from cash results
In the second quarter of 2026, Alphabet reported $119.8 billion in revenue, increasing the figure by 24% year-over-year. Google Cloud revenue grew by 82%, reaching $24.8 billion, while the division's operating profit was $8.81 billion.
However, the consolidated net income included a large non-cash result from the revaluation of financial investments. The company disclosed non-operating income of about $98 billion, primarily due to the unrealized growth in the value of equity securities.
Meanwhile, the operating cash flow was $39.07 billion, and cash capital expenditures were $44.92 billion. Consequently, the quarterly FCF was negative at –$5.86 billion. Over the past 12 months, the free cash flow remained positive at $53.27 billion.
These figures show how important it is to compare metrics over the same periods. One quarter of negative FCF does not imply that the company has lost the ability to finance investments from its own funds. However, the combination of rising capital expenditures and significant infrastructure costs requires a more careful assessment of future profitability.
Comparison of financial models of major players
Company | Reporting Period | Financial Metrics | Key Question |
|---|---|---|---|
Nvidia | Q2 FY2027 | Revenue $96.2 billion, gross margin 75% | Will the scale of GPU purchases be maintained? |
TSMC | Q3 2026 | Revenue NT$1.49 trillion, net margin 51.1% | Will the expansion of production capacities pay off? |
Microsoft | Q4 FY2026 | OCF $55.4 billion, FCF $19.6 billion | Will high cash returns be maintained? |
Meta | Q2 2026 | CapEx including leases $31.08 billion, FCF $784 million | Will AI increase ad profitability quickly enough? |
Amazon | TTM as of 30.06.2026 | OCF $161.4 billion, FCF -$7.6 billion | When will infrastructure investments start providing positive FCF? |
Alphabet | Q2 2026 | OCF $39.07 billion, FCF -$5.86 billion | How quickly will the growing Google Cloud justify CapEx? |
Oracle | Q1 FY2027 | CapEx $28.50 billion, FCF -$5.40 billion | How will further investments be funded? |
CoreWeave | As of 30.06.2026 | Debt obligations $35.55 billion | How sustainable are debt payments and client contracts? |
Sources — official quarterly reports of companies, SEC documents, and Investor Relations pages. TTM means the last 12 months. CapEx, FCF, and financial lease metrics are not always calculated using the same methodology, and reporting periods differ. Therefore, the table is intended for comparing financial models, not for mechanically ranking companies by a single ratio.
The main takeaway from this comparison is that the AI boom is being financed in several ways. Large hyperscalers have significant operational flows that allow them to sustain investments even with a temporary decline in FCF. Specialized infrastructure operators may be much more dependent on new capital raising, credit conditions, and timely execution of client contracts.
Oracle and CoreWeave show another side of the investment cycle
While Microsoft, Amazon, and Alphabet can rely on mature business segments, specialized infrastructure models require closer analysis of the obligation structure. A data center operator's business can grow revenue quickly while simultaneously experiencing significant financing needs. The reason lies in the mismatch between the timing of cash outflows and the receipt of client payments.
Oracle increases capital expenditures faster than current cash flow
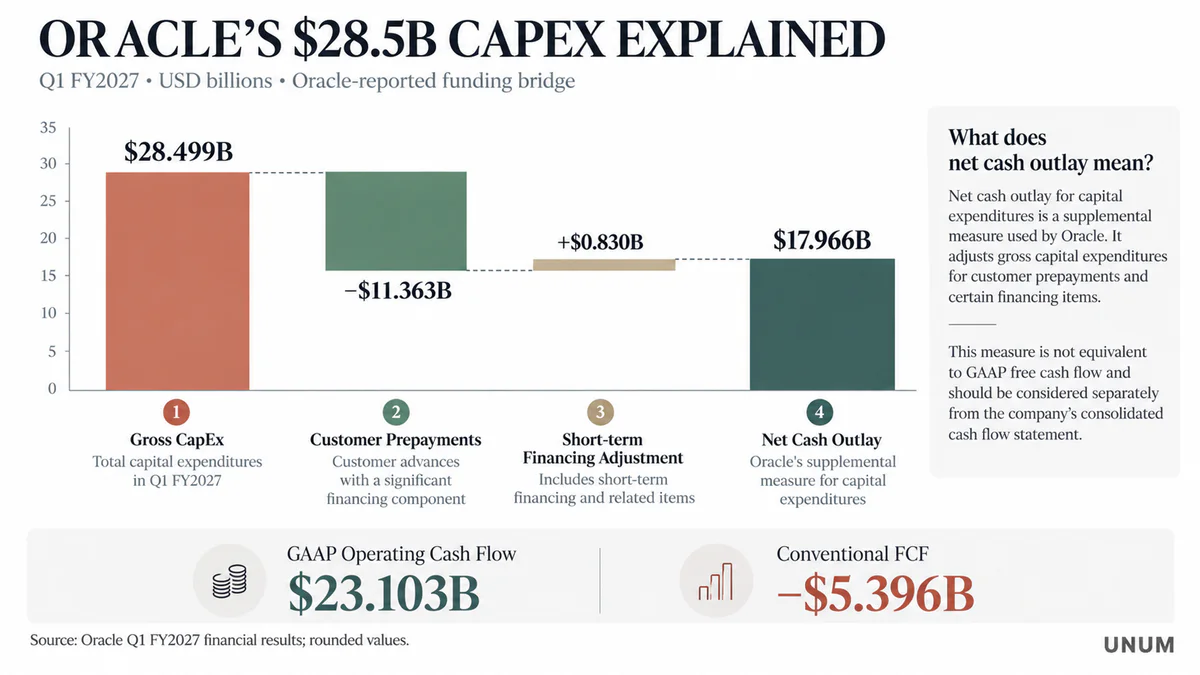
By the end of the first quarter of fiscal year 2027, Oracle's operating cash flow included $11.36 billion in customer prepayments with a significant financial component. According to the company's additional methodology, the net cash outflow for capital expenditures, considering customer and short-term financing, amounted to $17.97 billion. The free cash flow was negative, totaling –$5.40 billion. For comparison, in the first quarter of the previous fiscal year, capital expenditures were $8.50 billion. Thus, their volume more than tripled.
Oracle's operating cash flow included $11.36 billion in customer prepayments with a significant financial component. According to the company's additional methodology, the net cash outflow for capital expenditures, considering customer and short-term financing, amounted to $17.97 billion.
Oracle's uniqueness lies in the combination of rapid cloud infrastructure expansion, large customer commitments, and a growing need for capital.
However, the volume of concluded contracts should not automatically be considered guaranteed cash flow. The contract value may include services the company will provide over several years, and the actual revenue recognition depends on equipment readiness, capacity availability, and fulfillment of contractual terms.
Investors evaluating Oracle's stock should consider the difference between the contractual value of future services and current cash inflows. From an investor's perspective, three circumstances are crucial: when cash inflows will occur, what expenses will need to be incurred before receiving them, and how well financing obligations align with the terms of customer contracts.
Even with rapidly growing demand, delays in data center commissioning can worsen current liquidity, as some expenses will need to be paid before the corresponding assets begin to fully generate revenue.
CoreWeave combines high growth with substantial debt burden
An even more illustrative example is CoreWeave, one of the major specialized cloud computing providers for artificial intelligence.
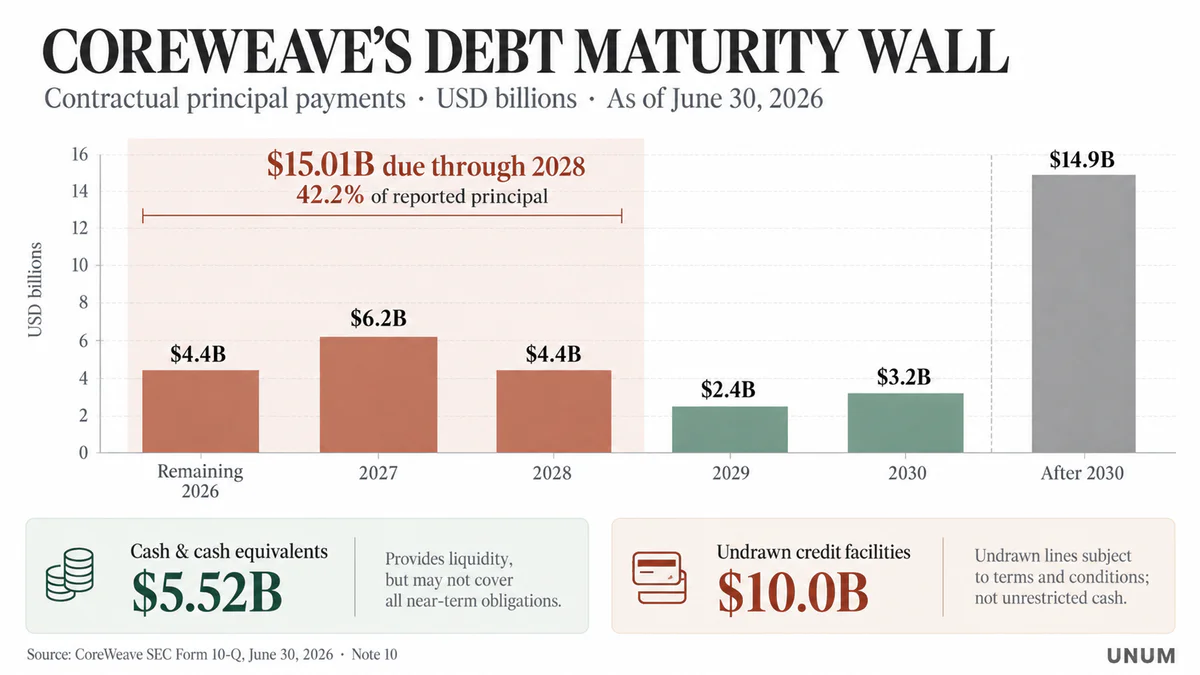
According to the Form 10-Q report for the second quarter of 2026, CoreWeave disclosed a schedule of future principal debt payments amounting to $35.551 billion. This figure reflects contractual repayments and should not be automatically equated with the balance sheet value of debt or all company obligations.
According to the disclosed payment schedule, approximately $4.41 billion of principal debt was due for the remainder of 2026, $6.18 billion for 2027, and another $4.42 billion for 2028.
Consequently, only for the period up to the end of 2027, about $10.60 billion in contractual repayments are due, which is nearly 30% of the debt amount as of the reporting date.
This does not mean that the company is obliged to repay the entire amount solely from current revenue. Some obligations may be refinanced, and certain credit agreements are secured by specific assets and contracts.
Nevertheless, the scale of upcoming payments demonstrates a high dependence of the financial model on capital availability.
CoreWeave's interest expenses for the second quarter amounted to $558 million, considering the capitalization of some interest as applied in the reporting. This is equivalent to approximately 21.7% of quarterly revenue, although a direct comparison of these figures does not replace the calculation of the interest coverage ratio.
The financing structure deserves special attention. In 2026, CoreWeave raised funds through various debt instruments, including floating-rate loans and fixed-income bonds. Among the disclosed issues are $2.75 billion bonds at 9.75% per annum maturing in 2031 and $1.25 billion bonds at 9.625% maturing in 2032.
To assess risk, it is necessary to consider the difference between these instruments. A fixed rate protects the company from an immediate increase in interest expenses on already issued debt, while floating-rate loans are more sensitive to changes in underlying market rates.
Contractual revenue both reduces and concentrates risks
Long-term agreements with clients provide operators with visibility into future revenue but can create dependency on a limited number of buyers.
The CoreWeave report reveals that in the second quarter of 2026, the three largest clients accounted for 36%, 26%, and 10% of total revenue, respectively. Collectively, they accounted for about 72% of sales.
The company also indicated that approximately 98% of quarterly revenue was related to clients' contractual obligations.
This combination has a dual effect. On one hand, confirmed contracts allow for planning the load of computing capacities and increase the predictability of inflows. On the other hand, financial difficulties or changes in investment plans of several major customers can impact a significant portion of the business.
In public reporting, the identification of major clients does not always allow for accurately determining their names, so linking specific percentage shares to individual tech companies without direct disclosure would be incorrect.
Nebius offers another model for expanding AI infrastructure
Nebius is also actively investing in cloud computing and data center development. However, its funding combines various sources of capital, so it is not appropriate to automatically apply CoreWeave's debt risk metrics to it.
In its report for Q1 2026, Nebius indicated capital expenditures of about $2.5 billion, primarily related to the purchase of GPUs, associated equipment, and data center expansion. Nebius raised approximately $775 million under its first secured credit agreement related to GPU infrastructure and contractual cash flows.
The company also considered asset-backed financing, corporate debt, funds from clients, and prepayments as potential sources of capital.
The main question for such a business is whether the growth in commercial load can offset investment costs quickly enough to limit reliance on subsequent capital raising.
Thus, Oracle, CoreWeave, and Nebius demonstrate different infrastructure models. They are united by high capital intensity, but financial risks are determined by debt structure, liquidity, contractual revenue, and equipment usage conditions.
How debt financing changes risks in the AI industry
The growth of corporate debt does not in itself indicate a financial crisis. For capital-intensive industries, debt financing is a standard development tool that allows the cost of infrastructure assets to be spread over a long period.
However, the sustainability of such a model depends on the alignment between cash inflows and the schedule of obligations.
For AI data centers, this issue is complicated by the relatively rapid technological updates of equipment. The performance of new GPUs is increasing, computing architectures are changing, and the cost of operating previous generations may become less competitive.
Therefore, even physically operational equipment can lose some economic appeal before the end of its technical service life.
This risk is particularly important for loans secured by computing equipment. If the market value of the collateral decreases faster than expected, creditors may require additional collateral or change the terms of new loans.
As a result, several interconnected pressure mechanisms arise:
Interest rate risk. The rising cost of floating debt and new borrowings increases cash expenses for financing servicing.
Refinancing risk. Repaying an existing loan may require raising a new one on less favorable terms.
Asset depreciation risk. Changes in the technological characteristics of GPUs affect the value of collateral and the economics of operation.
Contractual risk. Delays in capacity commissioning, changes in demand, or issues with major clients can worsen expected cash flows.
Liquidity risk. Even an economically promising project may experience a temporary cash shortfall when the timing of expenses and receipts does not align.
Additional complexity is created by obligations that are not always reflected in the corporate debt line. Financial leases, guarantees, long-term equipment purchase contracts, and construction commitments can form significant future payments.
Therefore, to assess the debt burden of tech companies, a single Net Debt / EBITDA ratio is insufficient. It is also necessary to examine interest expenses, available liquidity, contractual repayments, capital commitments, and the business's ability to generate free cash flow.
Energy becomes a financial constraint on AI growth
The issue of capital expenditures in the AI industry is not limited to the cost of servers and loans.
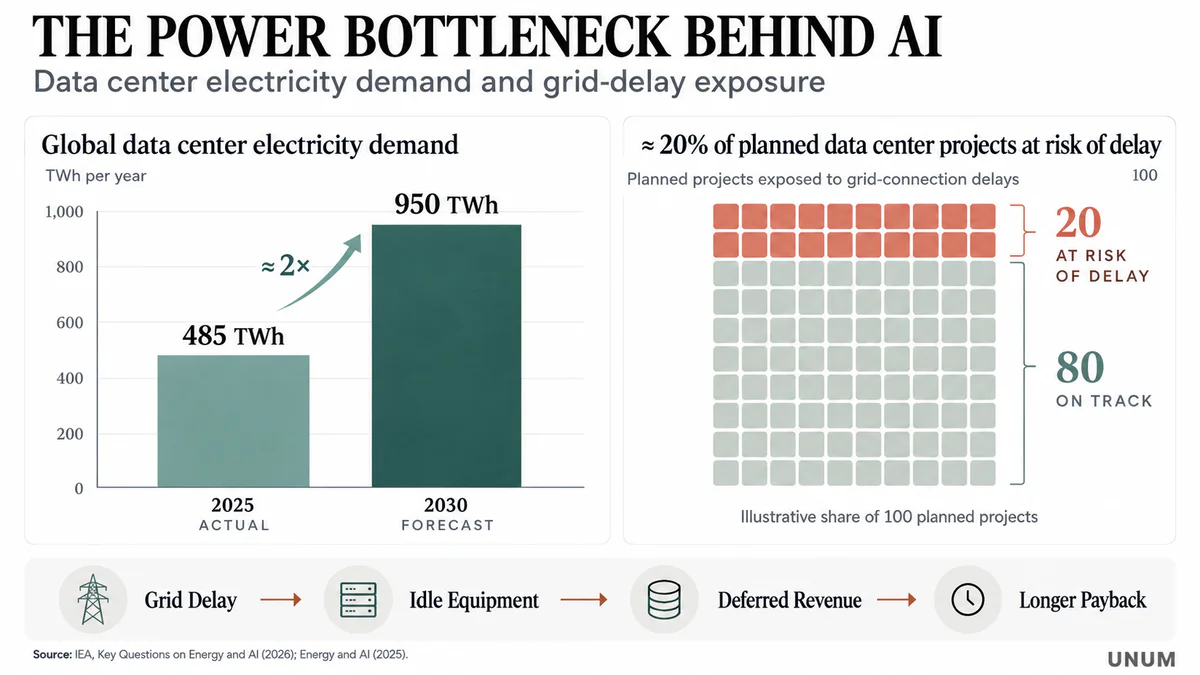
As the number of data centers increases, so does the demand for electricity, network equipment, and cooling systems. At the same time, creating energy infrastructure often takes longer than supplying computing equipment. According to the IEA, network constraints could delay the connection of about 20% of the global data center capacity planned for construction by 2030.
In the updated study Key Questions on Energy and AI, the International Energy Agency estimates global electricity consumption by data centers at 485 TWh in 2025 and forecasts an increase to approximately 950 TWh by 2030.
Thus, the central scenario of the IEA suggests almost a twofold increase in consumption over five years. By the end of the decade, data centers may account for about 3% of global electricity demand.
It is important to note that the forecast covers data centers as a whole, not exclusively AI workloads. Meanwhile, electricity used directly for AI, according to the agency, will grow faster than the industry's overall consumption.
The density of energy consumption is also increasing. Modern AI racks require significantly more power than traditional server infrastructure, creating additional demands on power supply, cooling, and grid resilience.
Why high electricity prices are not the only problem
For a data center operator, the cost per kilowatt-hour matters, but in some regions, the inability to connect the facility to the grid in a timely manner may be a more serious issue.
If the equipment is already purchased but full power supply is unavailable, the company faces delays in commissioning capacities. Meanwhile, loan interest, rental payments, and some project maintenance costs continue to accumulate.
Thus, the lack of physical infrastructure directly affects the payback period of investments.
The IEA highlights the limited supply of transformers, power electronics, and gas turbines. In the US, some operators are considering local gas generation as a way to accelerate capacity commissioning, but this approach also requires significant investments and does not eliminate technological and regulatory constraints.
For a financial assessment of the project, it is necessary to consider several indicators simultaneously: available electrical capacity, connection time, electricity price, capital costs for energy infrastructure, and expected computing load.
Moreover, an energy shock can impact the AI industry through two channels. The first is related to the direct increase in operational costs of data centers, and the second is related to inflation and the cost of capital in the economy as a whole.
However, oil should not be considered the main direct source of electricity for most data centers. Its influence is primarily manifested through inflation, transportation costs, and the overall state of financial markets, whereas the cost of electricity supply depends on the regional generation structure and network tariffs.
Why the correction of AI stocks may spread beyond the tech sector
The high concentration of investments and capitalization of the largest tech companies creates an additional channel for risk transmission.
If several large issuers simultaneously revise their investment programs, the consequences may affect equipment manufacturers, contractors, data center operators, and financial organizations.
The possible mechanism looks as follows:
Reduction of hyperscalers' investment programs → decrease in new equipment orders → revision of revenue forecasts for suppliers → deterioration of cash flow expectations for infrastructure operators → increase in credit spreads and collateral requirements → further rise in financing costs.
This sequence is not inevitable. Its realization depends on the depth of expenditure revisions, contract structures, and companies' ability to compensate for the reduction of one demand source with others.
The International Monetary Fund in the April Global Financial Stability Report highlights the growing role of debt financing, private credit funds, and interconnections between participants in infrastructure projects.
It is important to distinguish between stock market correction and financial instability. A decline in the market value of shares does not mean that a company is unable to meet its obligations. However, problems may become systemic if borrowers' liquidity, collateral quality, and creditors' willingness to provide new funds simultaneously deteriorate.
What can amplify the spread of financial stress
One factor is the involvement of non-bank financial institutions. Private credit funds can finance projects that find it difficult to obtain traditional bank loans, but the structure of such agreements is often less transparent to public investors.
The concentration of large tech companies in stock indices also matters. If investors simultaneously reduce positions in the most expensive and capital-intensive issuers, pressure can spread through index instruments and portfolio strategies.
However, the mere presence of tech companies in indices does not prove the existence of systemic risk. Such a conclusion requires data on debt load, liquidity, asset correlation, and actual links between creditors and borrowers.
The main question is whether the potential revaluation of AI companies will remain primarily a stock market event or affect the availability of financing for real infrastructure projects.
How to monitor the tech market's reaction to financial risks
Changes in interest rates, quarterly reports, and revisions of investment programs can affect not only the shares of individual tech companies but also the dynamics of the largest stock indices.
One way to observe market reactions is to compare stock movements with changes in bond yields, credit spreads, and companies' fundamental indicators.
Broker AXI offers tools for trading contracts for difference (CFD) on international company stocks and stock indices. CFDs allow opening positions on price changes without acquiring underlying assets, but using leverage significantly increases potential losses.
CFDs are complex high-risk financial instruments. Leverage increases both potential profits and losses. Service availability depends on jurisdiction. The information is for informational purposes only and is not an investment recommendation.
How to Calculate AI Investment Resilience to Expensive Capital
To assess financial risk, it is not enough to know how much a company invests and the expected volume of future revenue. It is necessary to determine how cash flows will change if actual conditions turn out worse than planned.
The first key indicator is the ratio of capital expenditures to operating cash flow, or CapEx / OCF. The higher the coefficient, the more cash is directed towards investments rather than remaining for other business needs.
But even this indicator needs to be interpreted cautiously. A large company may have low current FCF due to temporary intensive construction while having sufficient liquidity reserves and stable operating income.
The second indicator is the ability to service debt obligations. It is necessary to examine not only Net Debt / EBITDA but also interest expenses, debt structure, repayment terms, and available credit lines.
The third indicator is the return on invested capital, or ROIC. It allows assessing whether business expansion creates economic value considering the capital invested in assets.
For AI infrastructure, it is especially important to compare ROIC with the cost of capital (WACC), which includes the cost of equity and debt financing. If the return on a new project consistently falls below the cost of attracted capital, scaling it may reduce the economic value of the business even with increased revenue.
How Much Does Raising Interest Rates Cost
Consider a hypothetical company with $10 billion in floating rate debt.
If the cost of financing increases by one percentage point and the increase applies to the entire amount for a year, additional interest expenses will amount to $100 million annually. With a two percentage point increase, expenses will rise by $200 million. This is an illustrative calculation, not an assessment of a specific issuer's obligations.
The real effect depends on how much of the debt has a floating rate, what hedging instruments the company uses, and when the credit terms are reviewed.
For companies with large fixed bond issues, current interest expenses may change much more slowly, and the main risk arises when refinancing the debt is necessary.
Why Data Center Load May Be More Important Than GPU Growth
Equally important is the risk of insufficient utilization of computing infrastructure.
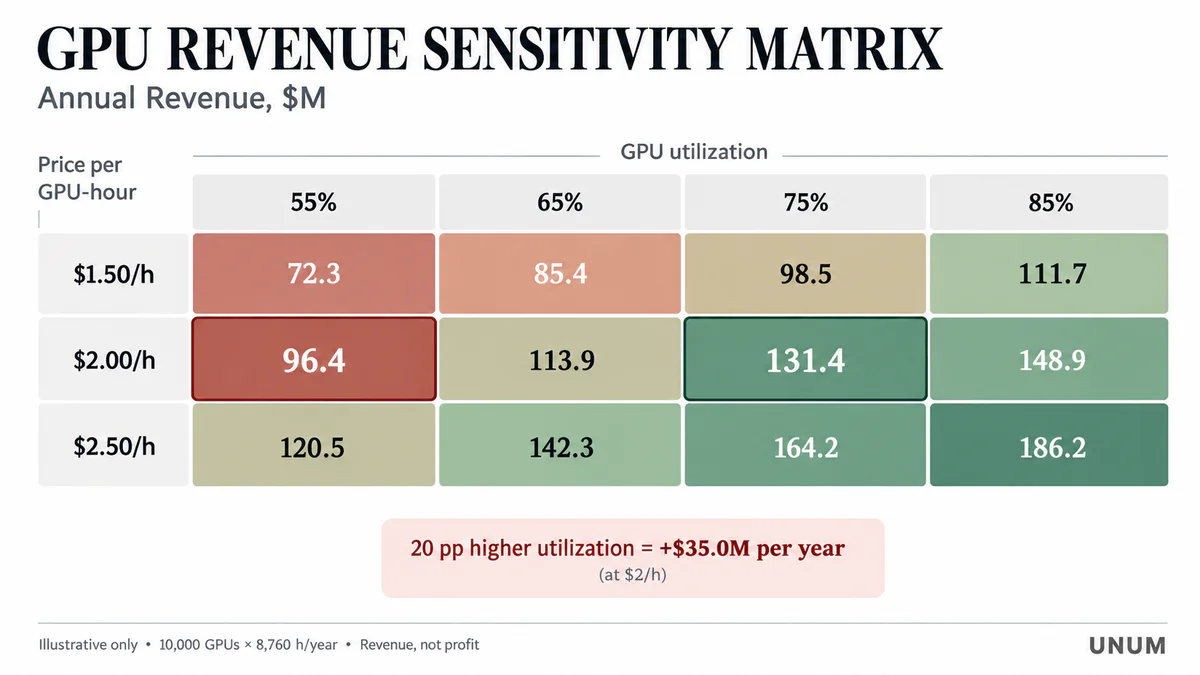
Suppose an operator has 10,000 GPUs, and the conditional price for paid use of one accelerator is $2 per hour. At full load, the theoretical annual revenue from such equipment would reach $175.2 million.
At 75% load, the figure decreases to $131.4 million, and at 55% load, to $96.36 million.
The difference between the last two scenarios is about $35 million in annual revenue, although the amount of equipment purchased remains unchanged.
This model is intentionally simplified: actual contracts may provide for capacity reservation, fixed payments, comprehensive services, and other conditions. Additionally, the calculation does not account for equipment downtime, network costs, energy consumption, depreciation, and financing.
Nevertheless, it shows why assessing the payback of data centers requires more than just considering the number of installed GPUs, commercial load of computing power, payment terms, and contract execution times.
It is necessary to understand which part of the computing power actually generates cash revenue, the cost of its use, and the expenses incurred during operation.
Three Scenarios for AI Industry Development by 2029
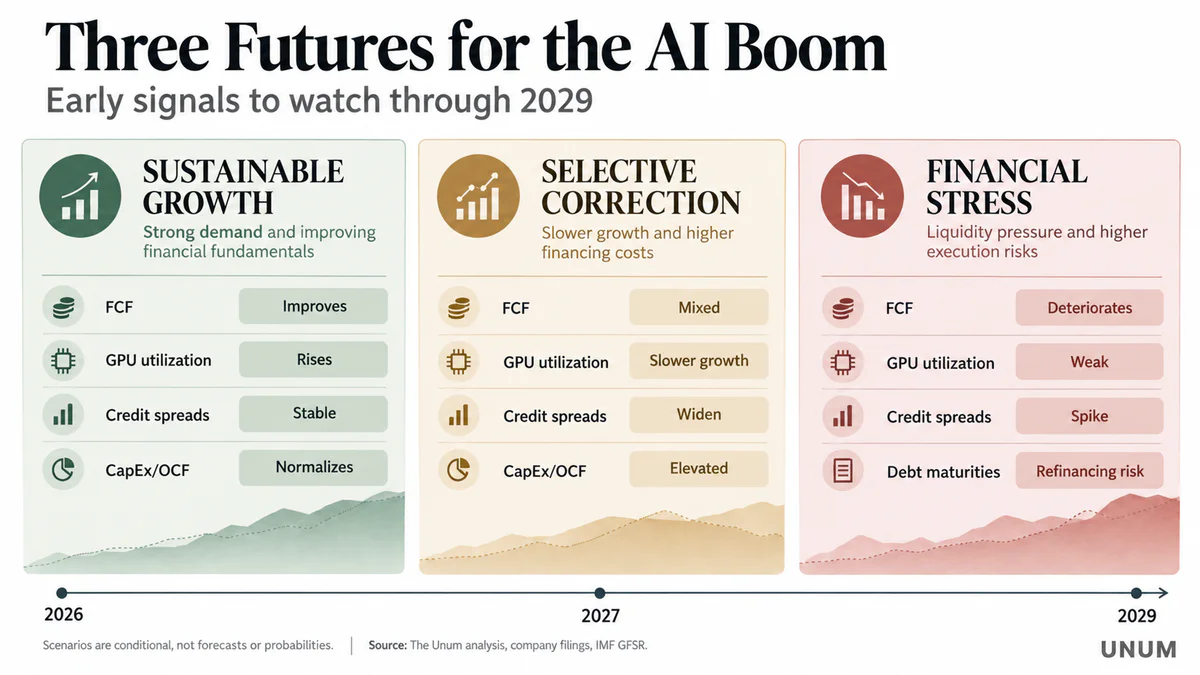
Current financial indicators allow identifying three possible market trajectories. They are not forecasts with calculated probabilities but represent scenarios whose conditions can be tracked through company reports and financial indicators.
Sustainable Growth and Gradual Increase in Profitability
In the first scenario, the demand for computing continues to grow, new data centers are introduced without significant delays, and companies gradually improve the efficiency of equipment use.
In such a scenario, the growth of revenue from cloud platforms and specialized operators allows for an increase in operating cash flow. After the most intensive investment phase is completed, CapEx stabilizes relative to revenue, and free cash flow begins to recover.
For chip manufacturers, this scenario means maintaining high demand, although growth rates may gradually normalize as the comparison base increases.
Key confirmations will include increased utilization of computing power, growth in operating margin, and improvement in the FCF to revenue ratio.
Selective Correction of the Most Capital-Intensive Companies
In the second scenario, demand for AI remains, but investors begin to more strictly differentiate between profitable business models and companies that need to constantly attract external capital.
Large hyperscalers continue to invest but may reconsider certain construction programs, postpone procurement timelines, or more actively demand proven returns on new projects.
Specialized operators, meanwhile, face rising financing costs and the need to increase the efficiency of already built infrastructure.
This scenario does not imply the end of the AI boom. Rather, it signifies a shift from evaluating companies based on revenue growth rates and contractual obligations to assessing cash flows, cost of capital, and investment returns.
For the stock market, the consequences may manifest in increased disparities between individual issuers rather than a synchronized decline of all tech companies.
Deep Financial Stress and Shortening of the Investment Cycle
The third scenario assumes a simultaneous deterioration of several conditions: demand for computing turns out to be lower than investment plans, financing costs remain high, and the commissioning of some infrastructure projects is delayed.
In this case, companies with large obligations may face liquidity constraints, the need to refinance on less favorable terms, or a revision of capital programs.
If such difficulties affect several large operators simultaneously, the consequences may spread to equipment suppliers, infrastructure contractors, and creditors.
However, a large-scale financial stress is not the result of just one quarter of negative FCF or a drop in tech stocks. A deeper combination of deteriorating solvency, refinancing issues, and insufficient liquidity of financial institutions is required.
Thus, even a negative scenario cannot be considered an inevitable result of high investments. Its realization depends on how sustainable the commercial monetization of AI proves to be.
Indicators to Determine the State of the AI Boom
Investors should monitor not only the value of tech stocks but also how the fundamental characteristics of companies are changing.
The most informative indicators may include the following:
CapEx and its relation to operating cash flow. Indicates what portion of internal resources is directed towards infrastructure expansion.
Free cash flow and its dynamics. Allows assessment of whether cash returns improve as revenue grows.
Credit spreads and terms of new bond issues. Reflect changes in credit risk assessment and financing costs.
Debt maturity schedules. Help identify periods of increased refinancing needs.
Data center utilization and computing revenue. Allow comparison of the scale of installed equipment with its commercial use.
RPO dynamics and recognized revenue. Helps determine how quickly signed contracts turn into delivered services.
Gross margin and ROIC. Show whether infrastructure expansion yields sufficient economic returns.
Cost and timelines for connecting energy infrastructure. Allow assessment of the risk of capacity commissioning delays.
None of the listed indicators provide a complete picture of financial stability. For example, an increase in RPO may indicate strong demand but simultaneously require additional investments to fulfill obligations.
And an increase in capital expenditures can worsen current FCF, although it may lead to a significant increase in cash generation in the future.
Therefore, the most informative approach is a combined analysis of several indicators over a long period, especially over the past four reporting quarters, with a comparison of annual dynamics.
Will the AI Boom Pay Off and Who Will Bear the Main Financial Risks
The financial results of 2026 do not suggest that the global AI boom has already turned into a bubble. On the contrary, the reports from Nvidia, TSMC, and ASML confirm the existence of substantial solvent demand for artificial intelligence equipment. Major cloud companies also show significant revenue growth from computing services, and the development of new products creates additional opportunities for monetizing technologies.
However, the presence of real demand does not guarantee the same return on investment for all market participants.
Equipment manufacturers receive a significant portion of the financial return at a relatively early stage of the investment cycle. Hyperscalers can finance infrastructure expansion through existing profitable segments, although CapEx growth reduces available free cash flow. Specialized operators, on the other hand, often rely more heavily on borrowed capital, the timing of large contract executions, and the ability of new capacities to quickly reach commercial load.
It is precisely the differences between these financial models that become a key risk factor.
High interest rates increase the cost of new borrowings and can put pressure on company valuations. Energy constraints can delay capacity commissioning, and technological equipment upgrades can shorten the period of its maximum economic efficiency.
At the same time, these same processes can create new opportunities. Lower computing costs make AI more accessible to businesses, increased productivity expands the number of economically viable applications, and scaling cloud platforms can improve cash returns over time.
Therefore, the most important question for the technology market is not whether the development of artificial intelligence will continue, but which companies will be able to turn technological advantage into a sustainable positive cash flow.
The next stage of the AI boom is likely to be determined not only by the number of GPUs purchased and the scale of announced investments but also by the return on capital required to create a global computing infrastructure.
It is the ability to finance new projects, service debt, and gradually increase free cash flow that will separate the long-term financial beneficiaries of the AI revolution from companies for which rapid growth will become a source of increased risk.
The material is prepared based on data available as of October 15, 2026. The main sources are financial reports and SEC documents of companies Nvidia, TSMC, ASML, Microsoft, Alphabet, Amazon, Meta, Oracle, and CoreWeave, as well as IMF research, IEA, and BLS statistics. Forecasts and scenario calculations are not guarantees of future results. The material is informational and analytical in nature and does not constitute an individual investment recommendation.