

The Market Again Between Inflation and Recession: What to Expect October 12–16
The new trading week begins with an uncomfortable combination for financial markets. Inflationary pressure is rising again amid expensive energy and increasing production costs, while signs are emerging that the high cost of money is increasingly affecting economic activity. In September, the U.S. economy created only 29,000 jobs, with unemployment at 4.2%, while consumer inflation remained at 3.4% annually in August. In the eurozone, the preliminary estimate of inflation for September has already risen to 3.8%.
This does not yet mean that the global economy is entering a recession. The July forecast from the International Monetary Fund projected global GDP growth of 3.0% in 2026 and 3.4% in 2027. However, the IMF simultaneously noted that the global process of reducing inflation has stalled.
An overview of the main events of the week will help understand what will drive the markets October 12–16 and which scenario will become the baseline for market forecasts — maintaining inflationary pressure or further economic slowdown.
What Last Trading Week Showed
The new week directly continues several stories that markets followed at the beginning of October. In the previous issue about events from October 5–11, we highlighted the Fed minutes, the ECB's position, the OPEC+ decision, the return of Chinese exchanges, and the impact of high bond yields on risky assets. Now part of the uncertainty has been removed, but the answers have raised new questions.
The Fed did not provide grounds to consider the September rate hike as the last one. At the meeting on September 15–16, the regulator raised the federal funds rate range by 25 basis points to 3.75–4%, and the minutes published on October 7 showed that most participants believed that another rate hike by the end of the year would likely be appropriate. However, future decisions, as emphasized by FOMC participants, will depend on new data and changes in the balance of risks.
Most participants considered that another increase in the target range for the federal funds rate would likely be appropriate by the end of the year.
Federal Open Market Committee (FOMC), minutes of the meeting on September 15–16, Federal Reserve System
For the market, this is especially important after the weak September employment report. If inflation now proves to be persistent, the Fed will have to choose between the risk of pressing too long on the economy with high money costs and the risk of easing the fight against prices too early.
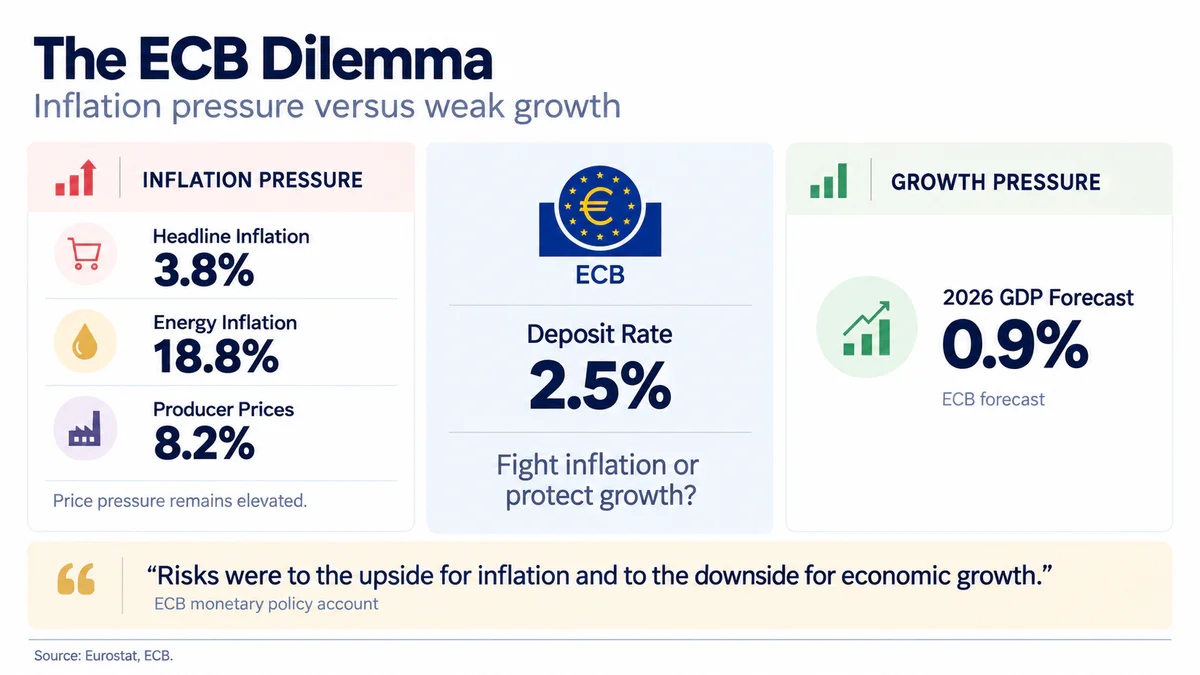
In Europe, the dilemma is even more pronounced. The detailed ECB report on the September meeting published on October 8 confirmed that within the regulator, there are simultaneously seen elevated inflation risks and risks of deteriorating economic growth. The ECB's baseline forecast suggests eurozone GDP growth of only 0.9% in 2026, then 1.4% in 2027, and 1.5% in 2028.
Risks to inflation were tilted to the upside, while risks to economic growth were tilted to the downside.
Governing Council of the ECB, report on the meeting of September 9–10, European Central Bank
In the oil market, OPEC+ also did not resolve the supply issue. On October 4, Saudi Arabia, Russia, Iraq, Kuwait, Kazakhstan, Algeria, and Oman decided to maintain the required production levels of September in November. The next group meeting is scheduled for November 1. Now the question shifts from the producers' decision itself to how well the current supply balance can withstand ongoing disruptions and how expensive energy will affect demand.
China, returning to full operation after a holiday week, sent mixed signals. The manufacturing PMI for September rose to 50.1 points, crossing back over the boundary between contraction and expansion. Production rose to 51.7, and new orders stood at 50.5. However, employment in the manufacturing sector remained below the expansion threshold at 48.4. In the non-manufacturing sector, overall activity was at 50.2, while new orders were significantly weaker at 46.5, and the purchasing price index rose to 52.5.
The picture at the start of the new week is therefore more complex than seven days ago: rates remain high, energy continues to exert inflationary pressure, but certain indicators of demand and employment already appear less confident.
US inflation will be the main test of the week
After the weak September employment report, the market needs to understand the second half of the Fed's equation—what is happening with prices. This is why the US statistics from October 14–16 will be the main block of the economic calendar.
On Wednesday, October 14, the BLS will release the CPI for September and data on real earnings. On October 5, the Producer Price Index (PPI) will be released, and on October 16, import and export prices will be published. On the same day, the Fed will release industrial production for September. Additionally, on October 14, the Beige Book will be released—a review of economic conditions in the 12 Federal Reserve districts, based in part on information from companies and market participants.
Why a single overall CPI won't be enough
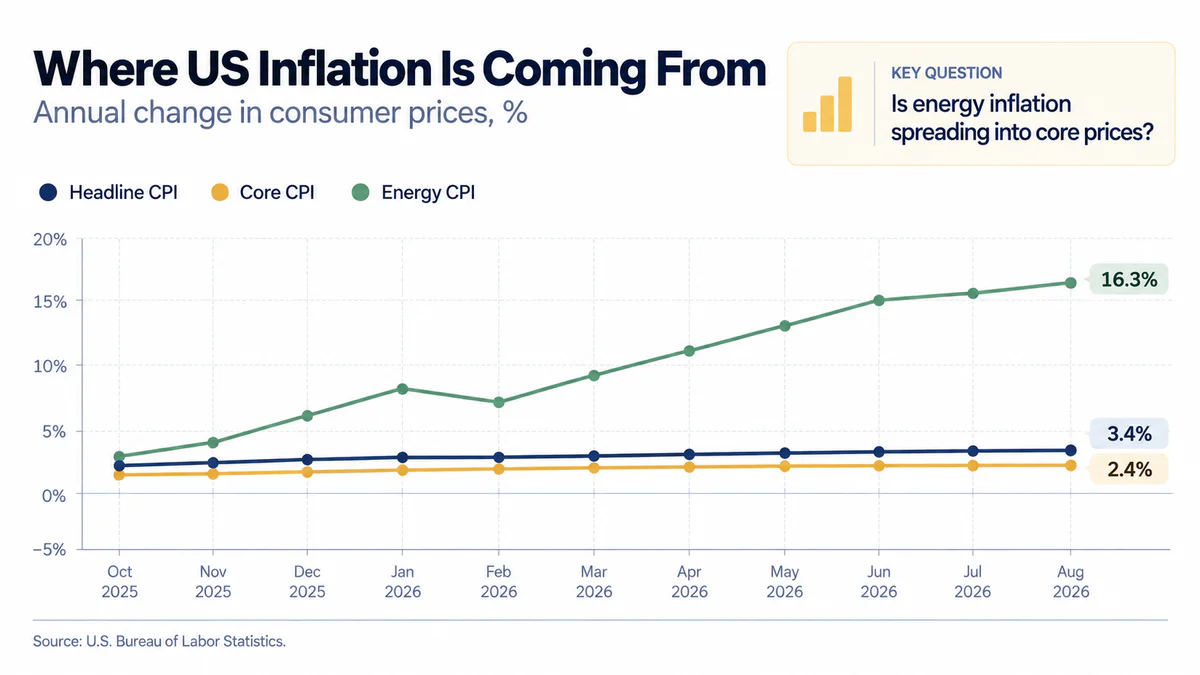
In the economic calendar of the week, US inflation will be the main guide for expectations regarding Fed interest rates. In August, the US Consumer Price Index rose by 0.4% for the month and by 3.4% for the year. The core CPI, which excludes food and energy, increased by 2.4% annually. Meanwhile, the energy component was already 16.3% above last year's level, and gasoline prices rose by 27.4%. More than a third of the entire monthly increase in the CPI in August was due to gasoline.
Therefore, the September report needs to be read in two stages. First, the market will assess how much energy continued to drive the overall CPI. Then—the much more important question—whether there are signs of this pressure spreading to other categories: housing, services, and goods excluding food and energy.
If the overall CPI accelerates mainly due to fuel, but core inflation remains stable, the Fed may perceive part of the shock as external. However, if both core CPI and services begin to accelerate simultaneously, the risk of a more prolonged inflationary cycle will become significantly higher.
PPI will show price pressure before it reaches the consumer
The next level of analysis will appear on October 15. In August, the US PPI for final demand rose by 5.4% year-on-year and by 0.4% for the month. Prices for goods increased by 1.1% m/m, the energy component of final demand by 4.2%, and the diesel fuel price index rose by 24.1% for the month.
This is important because the PPI helps to see inflationary pressure before it fully reaches the end consumer. If raw materials, transportation, and intermediate goods become more expensive, companies have two options: raise final prices or absorb part of the costs into their own margins.
For the stock market, the difference is crucial. The first scenario creates the risk of more persistent consumer inflation and a stricter Fed. The second can worsen corporate profits even without a strong acceleration in the CPI.
Retail sales will test whether the consumer can withstand
On the same day, October 15, the Census Bureau will release preliminary retail sales for September. August sales rose by 1.2% for the month and by 6.0% year-on-year, reaching $773.9 billion. It is important to remember that these figures are not adjusted for price changes, so in times of high inflation, part of the growth in nominal sales may be explained by goods simply costing more.
It is the combination of CPI, PPI, and retail sales that will provide the market with much more information than any of the reports individually.
Data Combination | What It Could Mean for the Market |
High Inflation + Strong Sales | Demand remains resilient, giving the Fed more room to maintain or further tighten policy |
High Inflation + Weak Sales | The most inconvenient combination — price pressure persists, but consumer purchasing power deteriorates |
Inflation Slows + Weak Sales | The risk of overheating decreases, and attention gradually shifts to economic growth and the labor market |
On Friday, this picture will be complemented by import and export prices and industrial production. If labor market weakness begins to combine with a decline in production and consumption, the discussion about recession risk will become more convincing. However, if domestic demand remains strong amid high inflation, the main market concern will again be the trajectory of rates.
What to watch: headline CPI, core CPI, energy and housing prices, PPI, retail sales, industrial production, two-year and ten-year Treasury yields, DXY, S&P 500, and Nasdaq 100.
IMF to Assess the Scale of Global Slowdown Risk
For global markets, the new IMF forecast will be one of the key macroeconomic assessments of global economic growth. U.S. statistics will show the state of the world's largest economy, but almost simultaneously, markets will receive an updated assessment of the entire global picture. From October 12 to 18, the annual meetings of the IMF and World Bank Group are taking place in Bangkok, attended by finance ministers, central bank heads, and representatives of international financial organizations.
On October 13, the IMF will hold press conferences on the new World Economic Outlook and Global Financial Stability Report, on October 14, it will present the Fiscal Monitor, and on October 16, there will be a plenary session and a discussion between IMF Managing Director Kristalina Georgieva and Federal Reserve Chairman Kevin Warsh.
This is one of the most substantial blocks of the week, as the new forecast will help understand how much recent events have led the IMF to change its assessment of the global economy.
In July, the fund forecasted global GDP growth of 3.0% in 2026 and 3.4% in 2027. Conversely, global inflation was revised upward to 4.7% in 2026, after 4.1% in 2025. The IMF then directly indicated that the disinflation process, ongoing since early 2024, had stalled.
The IMF described the reason for the unusual situation as a clash of two opposing forces.
“The global outlook is being shaped by two powerful forces pulling in opposite directions.”
"The prospects for the global economy are being shaped by two powerful forces acting in opposite directions."
— Petya Koeva Brooks, Deputy Director of the IMF Research Department, speaking at the release of the July World Economic Outlook Update
The first force is a negative energy shock, which raises prices and reduces real incomes. The second is the investment cycle around technology and artificial intelligence, supporting production, investment, and countries integrated into the global technology chain.
This is why on October 13, it is more important to look at the revisions of forecasts rather than a single global GDP number. If the IMF lowers expected growth for 2026–2027 and simultaneously raises inflation, it will be a direct confirmation of the worsening growth and price combination. If the global economic forecast remains stable, arguments for an inevitable recession will, on the contrary, weaken.
The Global Financial Stability Report deserves special attention. High long-term yields, the cost of corporate financing, and the potential revaluation of expensive tech assets could turn an ordinary economic slowdown into a more serious problem through financial markets. In the July World Economic Outlook, the IMF already cited the sharp revaluation of financial assets as one of the main negative risks.
Bitcoin to Be Caught Between CPI and Risk Appetite
For Bitcoin, during the week of October 12–16, the main event will not be its own cryptocurrency calendar, but U.S. inflation. At this stage, it is useful to consider BTC alongside the bond market, the dollar, and tech stocks.
The macroeconomic chain looks like this: US CPI → Fed expectations → Treasury yields and DXY → global risk appetite → Nasdaq and Bitcoin
If the CPI and PPI turn out stronger than the market expects, investors may increase the likelihood of further policy tightening. Higher bond yields increase the opportunity cost of holding assets without fixed cash flow, and a strong dollar usually tightens financial conditions.
But for Bitcoin, this relationship is not mechanical. There is an additional demand channel: Spot Bitcoin ETF flows → capital inflow or outflow through spot Bitcoin ETFs → BTC.
Therefore, it makes sense to evaluate the reaction after the CPI across several markets simultaneously. If Treasury yields and the DXY rise, Nasdaq declines, and Bitcoin moves along with tech stocks, the macroeconomic explanation seems convincing. If BTC behaves noticeably differently, one should look at ETF flows, liquidations in the derivatives market, and other internal factors of the crypto market.
Another check will come from TSMC. A strong report can support sentiment around AI and the tech sector, while a weak company forecast may strengthen risk-off. For Bitcoin, in this case, it will be particularly interesting to see if its correlation with Nasdaq persists or if the cryptocurrency starts to form its own direction.
What to watch: BTC/USD, spot Bitcoin ETF flows, DXY, two-year and ten-year Treasury yields, and Nasdaq 100.
Expensive oil begins to test global demand
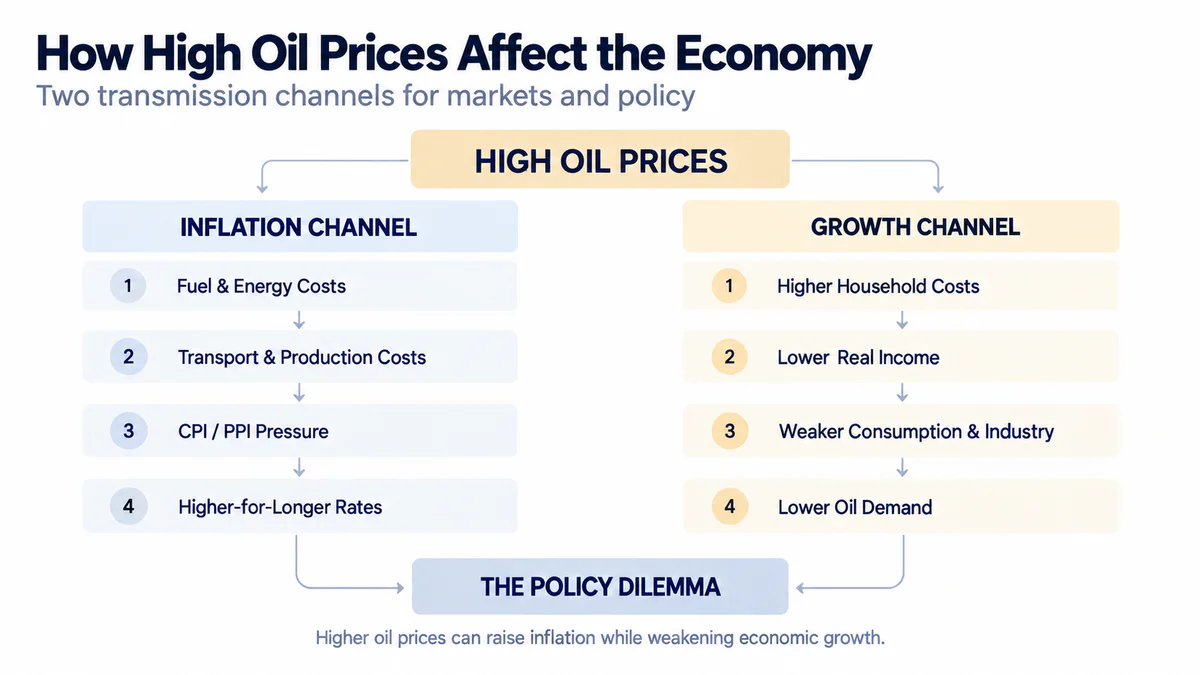
In the new week, the oil market should be viewed not only as a source of inflation. High oil prices increase energy costs for both households and businesses. At sufficiently high prices, energy itself begins to constrain economic activity: households have to spend more on fuel, companies on transportation and production, and some investment projects become more expensive.
After the OPEC+ decision to maintain November production targets, the main scheduled event will be the new Oil Market Report from the International Energy Agency, which will be released on October 14. The IEA analyzes global supply and demand, inventories, refining, and the oil products market.
The comparison base already looks unusual. In the September report, the IEA forecasted a decrease in global oil demand in 2026 by 2.5 million barrels per day, with this forecast worsened by 940 thousand barrels per day compared to the previous estimate. Global supply, according to the same estimate, is expected to decrease by 5.7 million barrels per day.
The inventory market is particularly indicative. According to the IEA, from February to August, observed global oil inventories decreased by a total of 507 million barrels, or an average of 2.8 million barrels per day. Simultaneously, disruptions most heavily affected middle distillates and petrochemical feedstocks, while refining capacities operated under extremely high margin spreads.
This results in two opposing channels of influence:
Oil → fuel and logistics → production costs → CPI and PPI → higher rates
and simultaneously
Oil → reduced real incomes → weaker consumption and industry → less energy demand
Therefore, the October IEA report will be important not only for Brent and WTI. If the agency again lowers the demand forecast, it may serve as evidence that the energy shock is already starting to erode some demand. If consumption forecasts remain more resilient, the market will refocus on limited supply and the inflationary effect.
China will show how much cost growth has reached the consumer
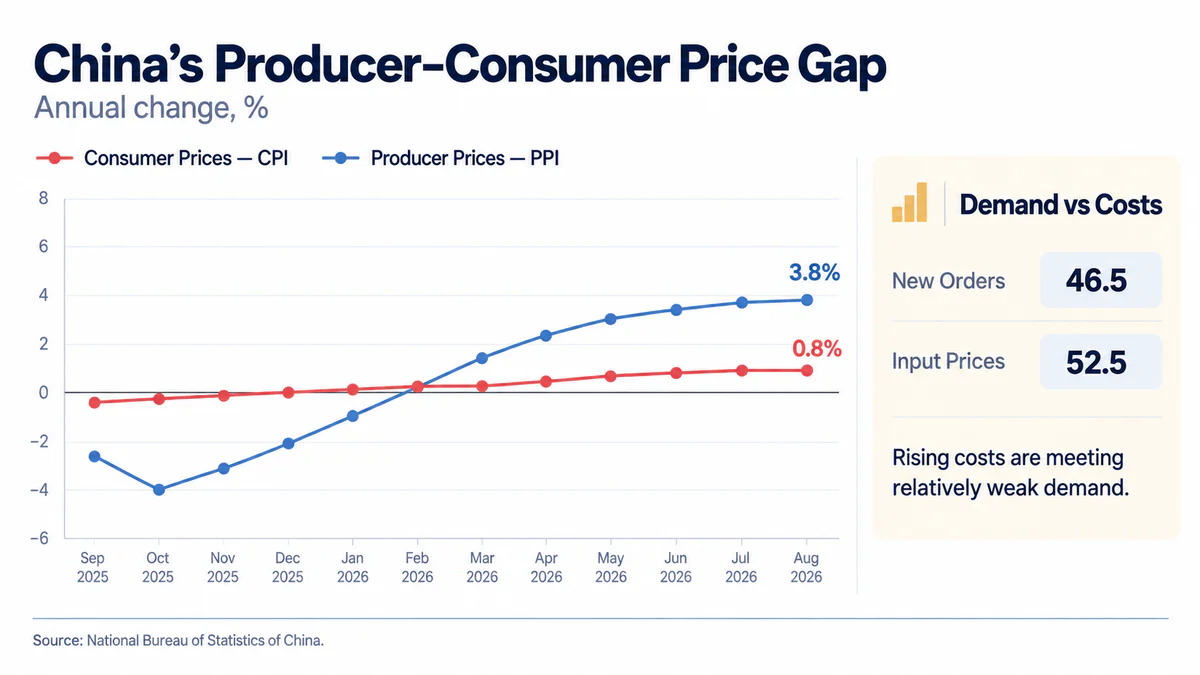
China enters the new week with a completely different inflationary structure than the US and Europe. Consumer prices are rising moderately, while production costs have already accelerated significantly. Therefore, China's CPI and PPI for September, which the National Bureau of Statistics will publish on October 14, will be a good test of where exactly the pressure is concentrated.
China's inflation will be a separate test for the Chinese economy: the divergence between China's CPI and PPI can affect not only company margins but also the yuan and the Chinese stock market.
In August, the CPI rose by only 0.8% year-on-year, while core inflation excluding food and energy was 1.0%. The PPI for the same period increased by 3.8%, with producer prices rising by 5.0%.
Together with the September PMI, this creates an important conflict for Chinese companies. The manufacturing PMI rose to 50.1 for the first time in several months, and new orders remained slightly above the growth threshold at 50.5. However, employment remained at 48.4. In the non-manufacturing sector, new orders were only 46.5, while input prices rose to 52.5.
In other words, costs are rising faster than final demand. If the September CPI starts to catch up with the PPI, it will mean that companies have more opportunities to pass on costs to consumers. If the gap persists, another scenario is more likely: weak pricing power forces businesses to absorb part of the cost increase into their own margins.
For the stock market, the second scenario is not necessarily positive just because the CPI remains low. Weak consumer demand amid rising purchase prices can worsen company profitability, especially in highly competitive sectors.
What to watch: CPI and core inflation, PPI, CSI 300, Hang Seng, CNY/CNH, copper, and other industrial metals.
Europe is edging closer to a stagflation dilemma
In the eurozone, the combination of high inflation and weak growth is particularly noticeable. This is not yet stagflation in the strict sense, nor is it a confirmed recession, but the data increasingly forces the market to assess this risk.
A preliminary estimate from Eurostat showed that annual inflation in the eurozone accelerated from 3.2% to 3.8% in September. The main source remains energy: its annual growth reached 18.8% compared to 14.3% in August. Services rose by 3.2%, and the indicator excluding energy, food, alcohol, and tobacco was 2.5%.
Price pressure is also evident earlier in the production chain. In August, producer prices in the eurozone rose by 8.2% year-on-year. The energy component increased by 21%, while producer prices excluding energy rose by 3.4%.
At the same time, the ECB's baseline scenario assumes real GDP growth in the eurozone of only 0.9% in 2026. Even in this scenario, average inflation is expected to be 3.0%, and in adverse scenarios, the combination of weak growth and stronger price pressure becomes significantly worse.
Data on eurozone industry will show how well the European economy withstands tight financial conditions and how challenging the ECB's monetary policy choices become.
The new week will provide two additional tests. On October 14, Eurostat will publish industrial production for August. In July, production in the eurozone already declined by 0.1% month-on-month and remained virtually unchanged from the previous year. Eurostat plans to release the full set of data on September's HICP on October 16.
Additional political context will be provided by the European Council meeting on October 15–16. European Council President António Costa, in his invitation to leaders, separately highlighted the need for temporary and targeted measures to mitigate the impact of high energy prices on citizens and businesses, as well as issues of competitiveness and Europe's dependence on fossil fuels.
The European bloc should also consider the UK. On October 15, the Office for National Statistics will publish the monthly GDP estimate for August along with service and production indices. This data will provide another indicator of how tight financial conditions are affecting European economies outside the eurozone.
For EUR/USD and European bonds, the central question will be: can the ECB maintain sufficiently tight policy if energy continues to drive inflation while industry and consumer demand lose momentum.
Asia to test resilience to expensive energy
Outside of China, two relatively small open economies will provide useful signals on how different economies adapt to expensive energy and high financial conditions.
Singapore to test inflation through exchange rate
On October 14, the Monetary Authority of Singapore will release its latest monetary policy decision. Unlike most central banks, MAS primarily manages conditions through the Singapore dollar exchange rate and the S$NEER corridor, rather than through a conventional key interest rate. The official MAS calendar confirms the publication of the Monetary Policy Statement and Macroeconomic Review on October 14. On the same morning, the preliminary GDP estimate for Singapore for the third quarter will be released.
In April, MAS slightly increased the pace of strengthening the currency corridor, and in July, it raised it again, albeit very slightly. This policy helps to limit imported inflation, which is especially important for an open economy heavily dependent on international trade and imported resources.
If the GDP estimate remains stable, the regulator will have more room to maintain a tight currency policy. If growth slows significantly, the balance between imported inflation and the state of the economy will become more challenging.
Australia to test quality of employment growth
October 15 will see the release of the Australian labor market report for September. In August, employment rose by 39.5 thousand people, but unemployment simultaneously increased from 4.5% to 4.6%, and labor force participation rose to 67.1%. More importantly, the structure: full-time employment decreased by 6.3 thousand, while part-time employment increased by 45.8 thousand people.
Therefore, the September report should be assessed not only by the overall change in employment. If job growth is again mainly driven by part-time employment amid rising unemployment, it will be a weaker signal than it might seem from a single overall figure.
For the currency market, the main indicators will be AUD/USD, Australian bond yields, and changes in expectations for the Reserve Bank of Australia's policy.
Banks to Show Consequences of High Cost of Money
Mid-October simultaneously opens a more substantial phase of the corporate earnings season. This time, bank results are particularly important not as a standalone stock market story but as a source of information on the state of credit, business, and consumer.
The new phase of the corporate earnings season will begin with the largest banks: the U.S. banking sector will show how high rates affect net interest income, credit demand, and credit risks.
October 13 will see third-quarter results from JPMorgan Chase and Citi, while October 14 will feature Bank of America and Morgan Stanley. The dates have been confirmed by the companies themselves in investor calendars.
High rates can initially help bank profits through interest margins. But the longer money remains expensive, the more important the downside becomes — weakening credit demand, rising deposit costs, and deteriorating borrower quality.
Therefore, reports should focus not so much on EPS relative to consensus but on economic signals:
Net interest income will show how much high rates continue to support interest income and how much the cost of bank funding is rising.
Growth in lending will help understand whether households and companies want to take on new credit at the current cost of money.
Provisions for loan losses will indicate whether banks expect deterioration in the quality of loan portfolios.
Credit cards and consumer banking will provide one of the most direct signals about the financial condition of the American consumer.
Income from investment banking services and trading income will help assess corporate activity and the state of capital markets.
The most concerning scenario for the economy is if banks simultaneously show weak credit demand and increased reserves for potential losses. Such a combination would mean that tight monetary policy is already being transmitted not only through bond prices but also through real decisions by companies and households.
Management comments will be especially useful. If bank executives start talking about rising delinquencies, more cautious consumers, or reduced corporate demand for financing, such assessments could be as important for macroanalysis as the quarterly figures themselves.
TSMC to Test the Second Pillar of the Global Economy
While the energy shock works against the global economy, the technological cycle is moving in the opposite direction. This contrast was used by the IMF in July as one of the main frameworks for the global forecast. TSMC's report on October 15 will show whether high demand for chips persists and how sustainable the investment cycle in the semiconductor sector is.
Before the quarterly report, signals remain strong. In September, TSMC's revenue amounted to NT$511.9 billion, up 54.6% year-on-year. From January to September, the company generated approximately NT$3.899 trillion in revenue — 41.1% more than a year earlier.
The company previously guided the market to third-quarter revenue in the range of $44.6–45.8 billion, a gross margin of 65–67%, and an operating margin of 56–58%.
Therefore, the question is not limited to whether TSMC will exceed its own forecast. For the entire global narrative, several other points are more important: the dynamics of demand for high-performance computing and AI chips, the use of the most advanced process technologies, capital investments, and management comments on orders for 2027.
Here arises a telling comparison. American banks will show the state of the traditional credit economy, while TSMC will show the state of the capital-intensive AI investment cycle. If consumer and credit demand weakens, but technological investments continue to grow rapidly, the global economy may continue to develop extremely unevenly. If both directions begin to weaken simultaneously, the risk of a significant global slowdown will increase noticeably.
Three Main Questions of the Week
1. Is the energy shock transitioning into broader inflation?
The answers will be provided by the US CPI and PPI, Chinese prices, final eurozone inflation, and the new IEA Oil Market Report. The most important signal is not the rise in energy itself, but the acceleration of prices in categories not directly dependent on oil.
2. How close has the high cost of money brought the economy to a significant slowdown?
Here, it is necessary to compare US retail sales and industrial production, the new IMF forecast, European industry, UK GDP, the Australian labor market, and the quality of credit portfolios of major banks.
3. Can the tech boom continue to offset the weakness of the traditional economy?
The answer will be provided by the new World Economic Outlook and the TSMC report. If AI investments continue to accelerate, the tech cycle remains an important pillar of global growth. If the momentum begins to weaken, the economy will have significantly fewer compensating factors.
Key Points by Day
Date | Region / Market | Event |
October 12, Mon | Global | Start of Annual Meetings of IMF and World Bank |
October 13, Tue | Global | World Economic Outlook and Global Financial Stability Report by IMF |
October 13, Tue | USA | Reports by JPMorganChase and Citi |
October 14, Wed | USA | CPI and real earnings for September |
October 14, Wed | USA | Fed's Beige Book |
October 14, Wed | China | CPI and PPI for September |
October 14, Wed | Oil | IEA Oil Market Report |
October 14, Wed | Singapore | MAS decision and preliminary GDP estimate for Q3 |
October 14, Wed | Eurozone | Industrial production for August |
October 14, Wed | USA | Reports by Bank of America and Morgan Stanley |
October 15, Thu | USA | PPI and retail sales |
October 15, Thu | UK | Monthly GDP for August |
October 15, Thu | Australia | Labor market for September |
October 15, Thu | Taiwan / Technology | TSMC Report |
October 15–16 | EU | European Council meeting |
October 16, Fri | Eurozone | Complete inflation data for September |
October 16, Fri | USA | Import and export prices, industrial production |
October 16, Fri | Global | IMF Plenary Session and conversation between Kristalina Georgieva and Fed Chair Kevin Warsh |
The key crossroads of the week is therefore not between 'good' and 'bad' economic data. An economy that is too strong can sustain inflation and high rates, while one that is too weak can heighten recession fears. For financial markets, the most comfortable scenario would be a gradual cooling of prices without a sharp deterioration in demand and employment. It is precisely the likelihood of such a soft scenario that the market will have to reassess after the US CPI, the new IMF forecast, oil statistics, data from China and Europe, and the first major reports of the new season.
This material is prepared solely for informational purposes and does not constitute financial advice or a recommendation.