

Some altcoins have gained more than 100% over a few months, while others barely keep up with Bitcoin or even lose value. Indices show varying degrees of altcoin strengthening, but not all models confirm the onset of an altseason. There is a noticeable gap in the crypto market between the returns of individual tokens and the results of most assets. Why is capital distributed so unevenly, and can selective growth be considered the beginning of a new altseason?
Previously, The Unum explored why the new altseason might differ from previous cryptocurrency cycles. Now let's look at the actual indicators: how many altcoins are outperforming Bitcoin, which assets show the highest returns, and what prevents growth from spreading across the entire market.
Three Views on Altseason
Altseason is commonly referred to as a period when a significant portion of alternative cryptocurrencies outperform Bitcoin in terms of returns. However, different analytical platforms use their own selections of assets and calculation methods, so their assessments may vary.
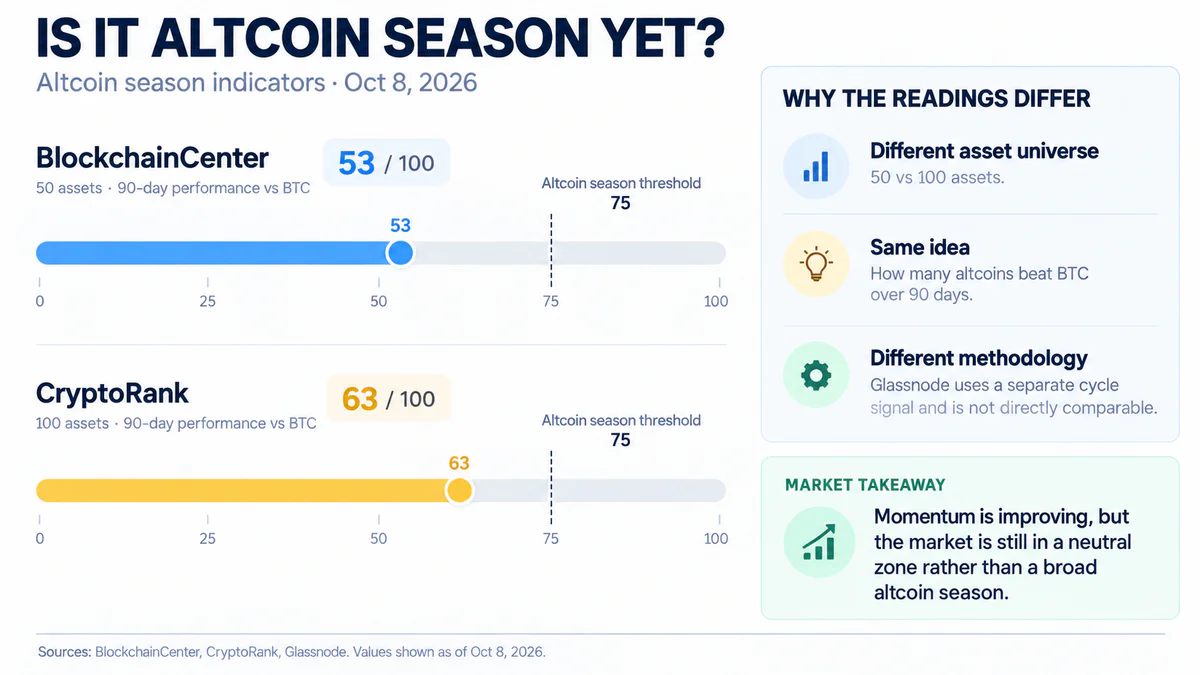
As of October 8, 2026, the Altcoin Season Index from BlockchainCenter stood at 53 out of 100 points. According to BlockchainCenter's methodology, altseason occurs when at least 75% of the top 50 eligible cryptocurrencies outperform BTC over 90 days. Stablecoins and tokens representing or backed by other crypto assets, such as WBTC and stETH, are excluded from the calculation.
Another indicator, the CryptoRank Altcoin Season Index, reached 63 points compared to 41 a month earlier. It is calculated based on the top 100 eligible cryptocurrencies. Thus, both indices show an increase in altcoins relative to Bitcoin, but neither reaches the established altseason threshold.
Meanwhile, CoinMarketCap also analyzes the top 100 assets over 90 days, while Glassnode uses a broader selection of 250 cryptocurrencies and its own Altcoin Cycle Signal model.
The difference between indices is not only due to the number of assets. The composition of the largest coins is constantly changing, so different assets with significantly different liquidity and volatility are included in the calculation.
The main contradiction lies in the fact that the market can show strong dynamics of individual tokens without meeting the common criteria of altseason. The growth of the index itself does not necessarily mean that altcoins are generally appreciating; they may simply be declining more slowly than Bitcoin.
Who Really Outperforms Bitcoin
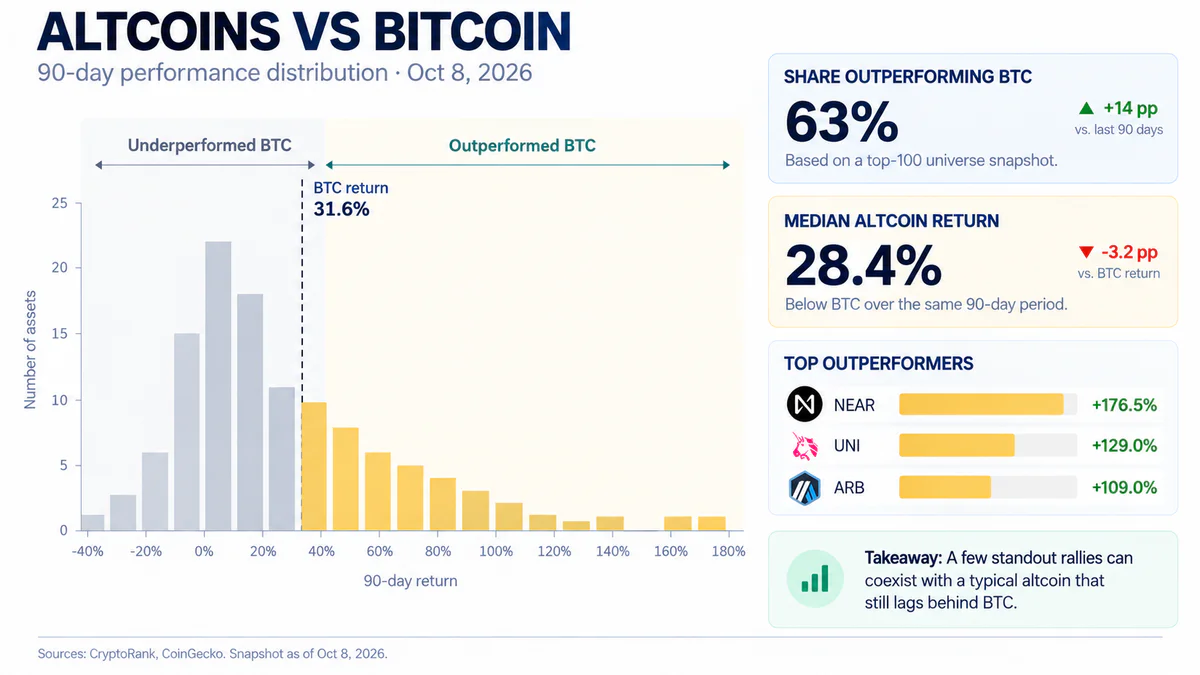
Differences become more apparent when comparing the returns of individual assets. According to CryptoRank data as of October 8, over the past 90 days, Bitcoin gained about 31.6%, while the results of altcoins varied significantly.
Cryptocurrency | 90-Day Yield | Difference with BTC |
NEAR | +176.5% | +144.9 p.p. |
UNI | +129.0% | +97.4 p.p. |
ARB | +109.0% | +77.4 p.p. |
SOL | +48.3% | +16.7 p.p. |
ETH | +47.0% | +15.4 p.p. |
BTC | +31.6% | — |
XRP | +29.4% | −2.2 p.p. |
DOGE | +20.2% | −9.8 p.p. |
Data as of October 8, 2026. Values are rounded. Difference with BTC is expressed in percentage points.
NEAR, Uniswap, and Arbitrum show triple-digit returns, but even among major cryptocurrencies, there is no unified direction. Ethereum and Solana outperform Bitcoin, while XRP and Dogecoin lag behind.
This demonstrates why evaluating altseason solely based on the most noticeable rallies is incorrect. The returns of a few leaders can create the impression of a broad recovery, although many other assets show significantly more modest results.
Moreover, outperforming BTC does not necessarily mean an influx of new capital into all altcoins. To assess the scale of movement, it is necessary to consider trading volumes, market depth, and capitalization.
Why Capital Doesn't Reach Everyone
The rise of individual altcoins is not always accompanied by a comparable increase in demand for other cryptocurrencies. Capital is distributed unevenly among assets, and price dynamics depend not only on investor interest but also on available liquidity, token supply volume, and market trends. Let's consider how these factors affect differences in altcoin returns.
Liquidity Becomes One of the Main Constraints
A strong price movement does not always mean that an asset can attract significant large trades without substantial price changes.
In CoinGecko's study from September 30, 2026, the depth of order books on eight centralized platforms is compared.
Analysts found that Ethereum's liquidity near market price was only 35–45% of the comparable liquidity of Bitcoin. In the previous year's study, the ratio was at least 60%.
The deterioration of Solana's metrics is even more noticeable. In the studied range, the depth of SOL bids on each side of the order book of the eight selected exchanges decreased from approximately $28 million in 2025 to $20 million in 2026.
Meanwhile, Bitcoin showed the opposite trend. The aggregate market depth of BTC on the eight studied exchanges increased by almost 50% compared to 2025. Median figures were about $29 million on the buy side and $37 million on the sell side.
These data do not mean that investors are completely leaving altcoins. However, they indicate that trading conditions for major digital assets are changing unevenly. Even significant price growth can be accompanied by limited liquidity, increasing the risk of slippage in large trades.
Token Offering Continues to Expand
Another factor is the increase in the number of cryptocurrencies competing for investors' attention.
According to CoinGecko's research from June 17, 2026, the number of tracked tokens in the DeFi category grew from 549 in January 2024 to 2,328 by May 2026. In the AI segment, the number of assets increased from 145 to 1,798, and in the tokenized real assets (RWA) category—from 64 to 1,282.
The expansion of offerings itself does not necessarily lower prices. However, new projects compete with existing ones for liquidity, users, and investment demand.
Additional pressure can be created by token unlocks. When previously locked tokens enter circulation, the volume of assets potentially available for sale increases. The consequences depend on the volume of the unlock, the behavior of holders, and the state of demand. Therefore, an increase in the number of available tokens does not mean that demand and liquidity will grow at comparable rates.
Demand Shifts Between Sectors
Selectivity is also noticeable in trading activity. In CoinGecko's report on KuCoin for the first half of 2026, the share of BTC and ETH in the volume of the 18 most traded spot pairs decreased from 74.3% to 45.2% by the end of June.
At the same time, the 15 most profitable spot assets on the platform showed growth of over 100% in the first half of the year, with leaders including tokens related to DeFi and artificial intelligence.
This is an example of active demand rotation but does not prove that similar dynamics are observed on other crypto exchanges. The results of a particular platform depend on its audience, available trading pairs, and listing features.
Market selectivity also affects the approach to trading altcoins. Instead of relying on the overall growth of cryptocurrencies, participants have to analyze individual assets and track changes in demand between sectors. Trading platforms, including Tradex, can be used to access the tools available on them, but trading conditions and associated risks require independent assessment.
How to Distinguish a Full Altseason from a Selective Rally
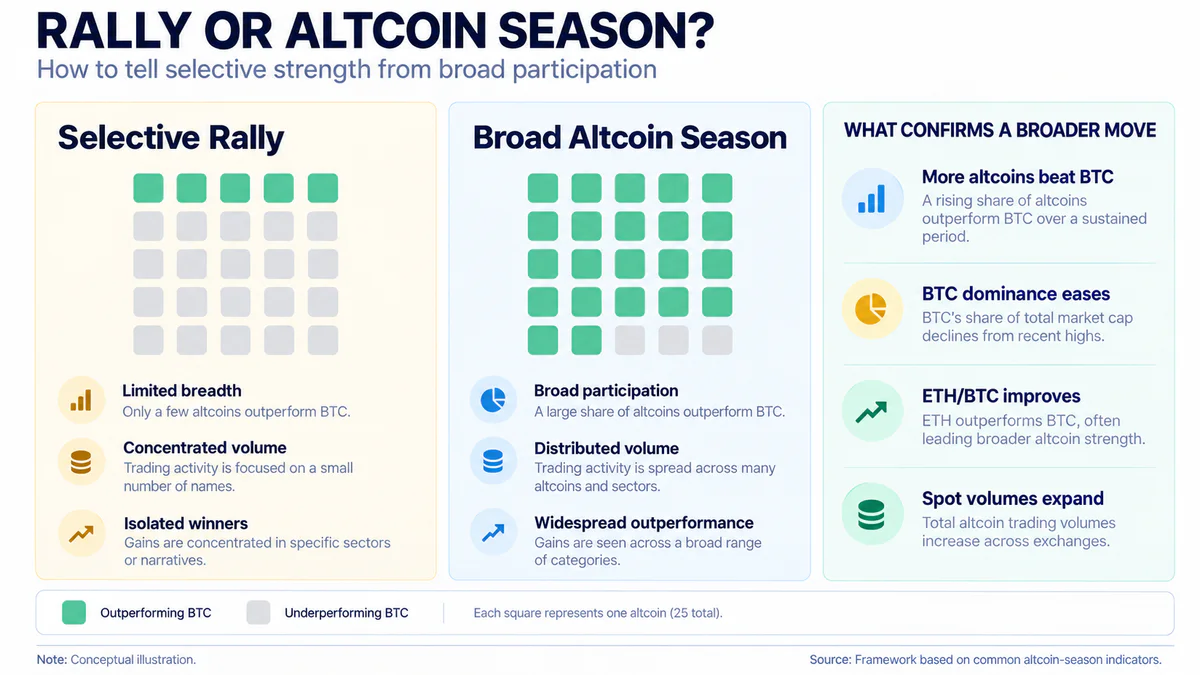
Since indices show relative returns, they need to be compared with other market signals. For a comprehensive market assessment, it is useful to compare five indicators:
Indicator | What May Indicate Rally Expansion |
Altcoin Season Index | A stable share of altcoins outperforming BTC approaches or exceeds 75% |
BTC Dominance | Bitcoin's share decreases amid rising altcoin capitalization |
ETH/BTC | Ethereum steadily strengthens relative to Bitcoin |
TOTAL3 | Capitalization of cryptocurrencies excluding BTC and ETH increases |
Spot Volumes | Growth in trading activity covers a larger number of assets |
However, each indicator has limitations. For example, a decrease in Bitcoin dominance may be due to an increase in stablecoin capitalization, and a rise in TOTAL3 may result from the price increase of a few major tokens.
Therefore, the importance lies not in a single index mark but in the convergence of multiple signals. If more altcoins start outperforming BTC, their combined capitalization increases, and liquidity and trading activity grow simultaneously, there are more convincing grounds to speak of a broad altseason.
Altseason May Be Here, But Not for Everyone
Data from October 2026 shows a mixed picture. Some altcoins significantly outperform Bitcoin, indices record strengthening positions, but the generally accepted altseason threshold has not yet been reached.
At the same time, liquidity and trading activity studies indicate significant differences between assets and platforms. This aligns with the hypothesis of more selective demand distribution, although it does not prove that a broad altseason is impossible in the future.
The further development of the market depends on whether the growth will spread to a larger number of liquid cryptocurrencies or continue to concentrate in individual projects. Therefore, the main question now is not only when the altseason will begin, but also how many tokens will actually be able to participate in it.
This material is prepared solely for informational purposes and does not constitute financial advice or a recommendation.