This material was prepared by UNUM in collaboration with the cryptocurrency exchange TRADEX. We analyzed changes in market capitalization, stablecoin dynamics, and liquidity conditions to understand why a decrease in Bitcoin's share does not always indicate increased demand for other cryptocurrencies.
Why Bitcoin dominance began to decline
BTC Dominance (BTC.D) shows the share of the total cryptocurrency market capitalization occupied by Bitcoin. It is calculated as the ratio of the market value of all circulating BTC to the total cryptocurrency capitalization. Its decline traditionally attracts market participants' attention, as in previous market cycles, such dynamics were often accompanied by the strengthening of altcoins.
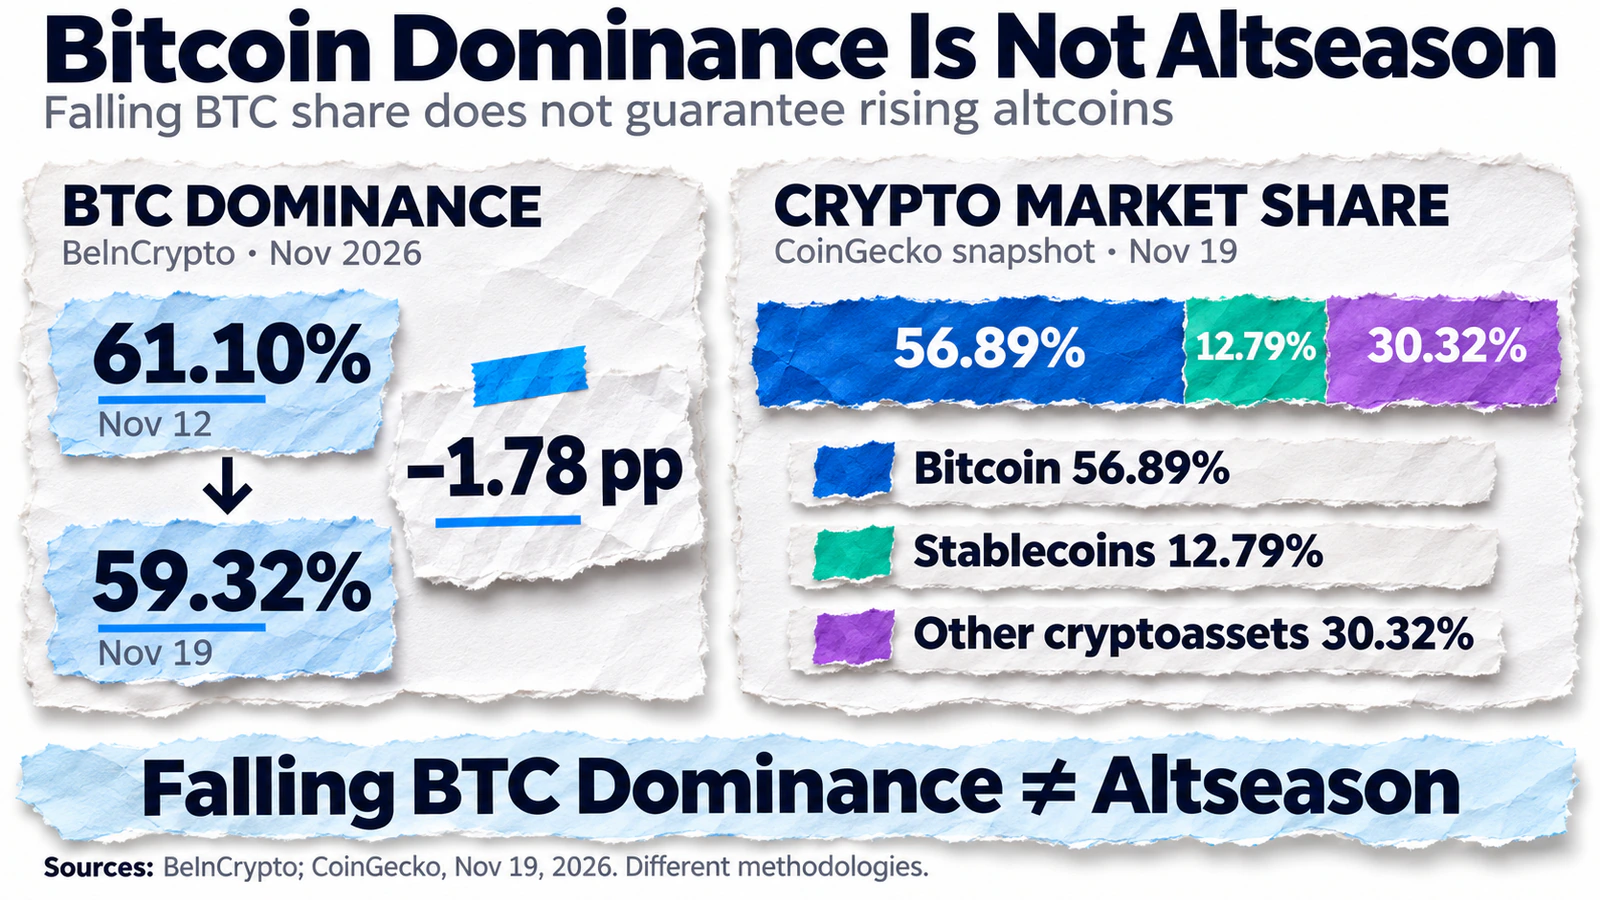
A study by BeInCrypto on November 19 notes that on November 12, Bitcoin dominance reached a local high of 61.10%, after which it dropped to 59.32% at the time of publication. The decrease was 1.78 percentage points, or approximately 2.91% relative to the initial value. It is important to distinguish these figures, as a change of 2.91% is not equivalent to a loss of 2.91 percentage points.
At the same time, figures from different analytical platforms can vary significantly. According to CoinGecko as of November 19, the total cryptocurrency capitalization was about $2.25 trillion, with approximately $1.28 trillion attributed to Bitcoin. Thus, BTC's share was estimated at 56.89%, and stablecoins at 12.79%.
The differences between CoinGecko and the data presented by BeInCrypto are partly due to the composition of the assets considered and the calculation methodology. Therefore, values from different sources cannot be used as a single time series to assess changes in Bitcoin dominance.
To understand the current market structure, three main segments can be identified.
Cryptocurrency market segment | Capitalization | Market share |
|---|---|---|
Bitcoin | $1.28 trillion | 56.89% |
Stablecoins | $289 billion | 12.79% |
Other crypto assets excluding stablecoins | about $680 billion | 30.32% |
Source: CoinGecko, November 19, 2026. Values are rounded. The capitalization of other crypto assets is calculated by subtracting the capitalization of BTC and stablecoins from the total amount, their share is the remainder up to 100%.
The main feature of BTC.D is its relative nature. The indicator can decrease not only due to the growth of other cryptocurrencies but also due to a faster decline in Bitcoin's capitalization. Even if the value of most altcoins is simultaneously decreasing, their total share can increase if BTC depreciates more.
Therefore, BTC.D movement should be compared with the absolute market capitalization. The current asset value, trading volumes, and market indicators can be tracked on the Bitcoin page in UNUM.
Why a decrease in Bitcoin's share does not indicate the start of altseason
Altseason is commonly referred to as a period when a significant portion of cryptocurrencies, excluding Bitcoin, shows higher returns relative to BTC. This does not refer to the successful performance of a few popular tokens but rather a broad market movement.
One of the assessment tools is the Altcoin Season Index by CoinMarketCap. According to the official methodology, an altcoin season is recorded if at least 75% of the leading cryptocurrencies considered outperform Bitcoin in terms of returns over the previous 90 days. Stablecoins and wrapped versions of other assets are excluded from the calculation as their price characteristics make direct comparison incorrect.
The opposite mode is called Bitcoin Season. According to CoinMarketCap's methodology, it is defined when no more than 25% of the considered cryptocurrencies outperform BTC over the same period. Intermediate values indicate the absence of a pronounced dominance of one segment.
In the UNUM article on altcoin results over 90 days, it was noted that on November 12, the altcoin season index according to CoinGlass was at 42 points. As of the check on November 19, CoinGlass showed about 52 points and classified the market state as neutral.
Although the indicator improved, it does not yet indicate a formed altcoin season. Moreover, the sample compositions and classification rules of CoinGlass and CoinMarketCap differ, so their values should not be considered fully interchangeable.
The relative performance of altcoins deserves special attention. If Bitcoin loses 15% over a certain period and an altcoin decreases by 8%, the latter outperforms BTC by 7 percentage points. However, such dynamics do not mean that altcoin holders received a positive return in dollar terms.
Therefore, a decrease in Bitcoin dominance may indicate improved relative results of individual cryptocurrencies, but to confirm an altcoin season, it is necessary to simultaneously assess the breadth of market growth, altcoin capitalization, and trading activity.
Stablecoins increase their share even as supply decreases
One of the most notable features of the current situation is the changing role of stablecoins. Assets like Tether (USDT) and USDC are used for settlements between crypto market participants, temporary storage of funds, and transitioning between trading positions.
During periods of increased volatility, participants may sell Bitcoin or altcoins for stablecoins, reducing their funds' dependence on cryptocurrency price fluctuations. However, an increase in the share of USDT alone does not prove that investors are massively transferring capital into this asset.
The reason lies in the specifics of calculating dominance. If the overall market capitalization decreases faster than the value of circulating stablecoins, their relative share automatically increases. This effect is possible even without additional issuance of USDT or USDC.
Capitalization data confirms the need to separate these indicators. According to DefiLlama, as of November 19, the capitalization of tracked stablecoins was approximately $283.1 billion, down 5.39% over 30 days. The market capitalization of USDT was estimated at about $175 billion, and USDC at $68.6 billion. Over the same period, USDT's capitalization decreased by 4.37%, and USDC's by 5.09%.
A similar trend was previously recorded by Glassnode. In the Running on Empty report from November 11, the company's analysts wrote:
Over the past 30 days, the aggregate supply of stablecoins has decreased by $14.2 billion — the fastest reduction since June 2022.
Thus, Glassnode recorded a decrease in the supply of tracked stablecoins, and DefiLlama noted a decline in their total market capitalization. Both indicators point to a weakening of this segment, although they are calculated using different methodologies and cover different sets of assets.
At the same time, an increase in the market share of stablecoins amid a decrease in their absolute value is not a contradiction. If the overall value of cryptocurrencies falls even faster, stablecoins can occupy a larger part of the market even with a reduced volume of funds represented by such tokens.
Previously, UNUM examined this trend in detail in the analysis “The stablecoin market shrank by $14.2 billion. What does this mean for cryptocurrencies”.
Where capital might actually be moving
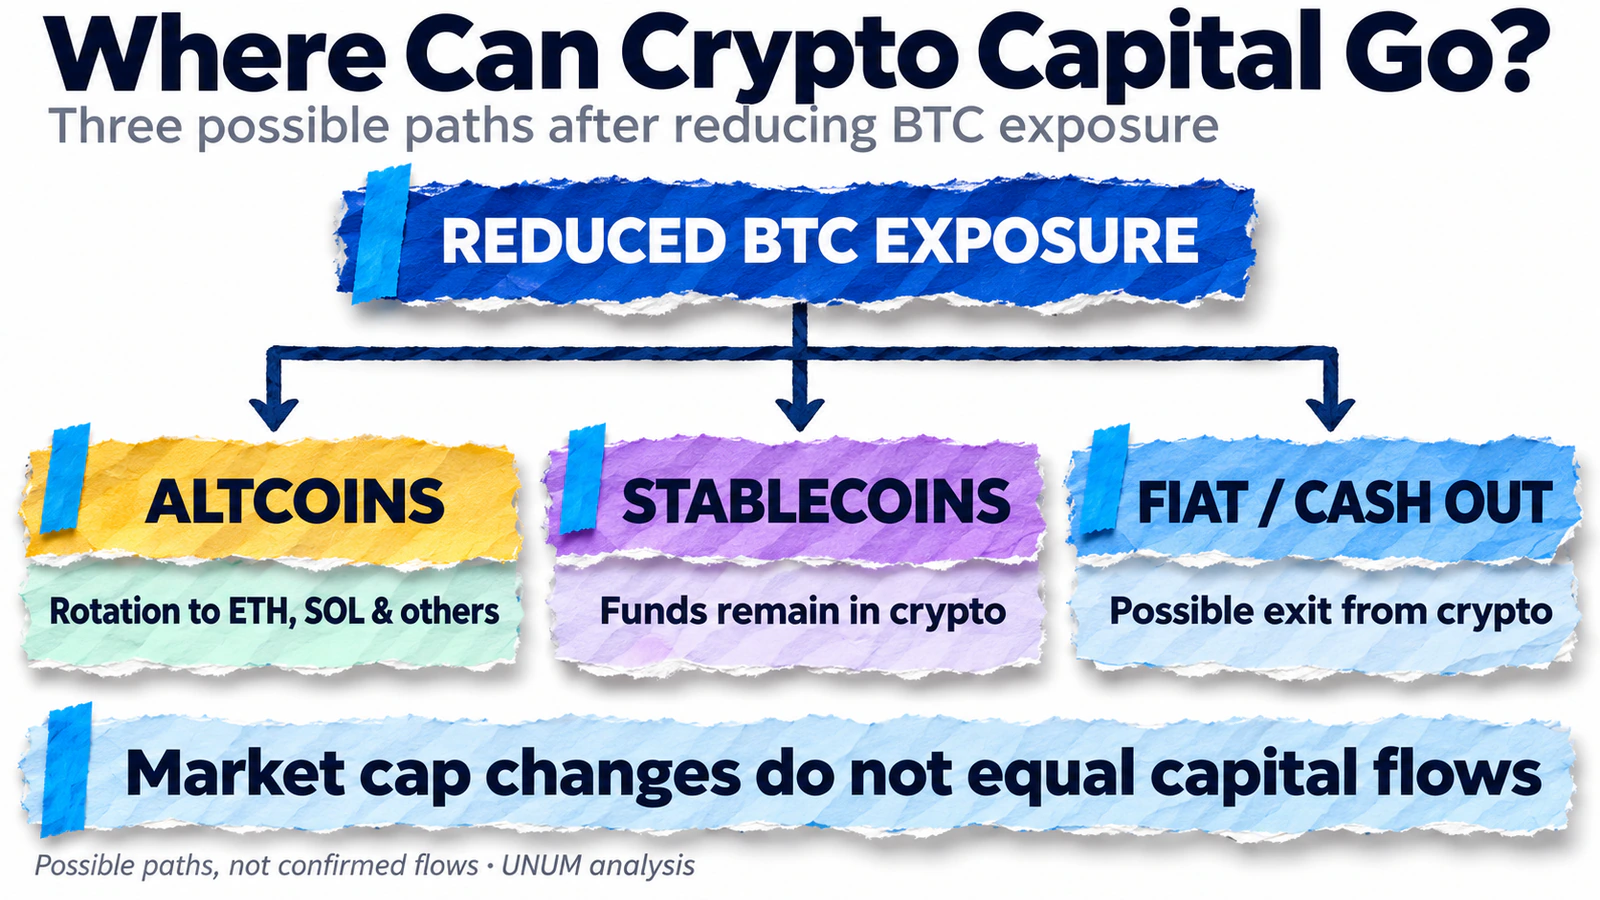
A decrease in BTC Dominance is often described as a flow of funds from Bitcoin to other cryptocurrencies. This shift in investment preferences is called capital rotation, but additional data is needed to confirm the actual movement of capital between segments.
Market capitalization is calculated as the product of the current asset price and the number of its units in circulation. Therefore, a change in the value of the entire segment is not equal to the sum of funds entering or leaving the market.
In the situation under consideration, it is necessary to distinguish several processes:
Redistribution between crypto assets. Participants sell BTC and buy ETH, SOL, or other cryptocurrencies. With sufficient demand, the capitalization of selected altcoins may grow faster than the capitalization of Bitcoin.
Transition to stablecoins. Investors reduce positions in volatile assets, keeping digital dollar funds on exchanges or in their own wallets. Such operations change the structure of portfolios but do not themselves increase the overall supply of stablecoins.
Withdrawal of funds from the crypto market. Owners redeem stablecoins for traditional currencies or reduce investments through other channels. Net redemption of tokens reduces their supply in circulation.
Data from Glassnode indicates that in early November, pressure was observed in several directions. In addition to the reduction in stablecoin supply, analysts recorded about $1.6 billion in net outflows from U.S. spot Bitcoin ETFs over 20 trading sessions as of November 9. This indicates a weakening of one of the investment demand channels, although it does not allow for a direct calculation of the total capital outflow from the entire crypto market.
Thus, the current picture does not boil down to a massive shift of investors into altcoins. Some participants may temporarily hold funds in stablecoins, some may reduce their market presence, and price changes further redistribute the relative shares of assets without a comparable movement of cash flows.
Why Liquidity Matters More Than a Single Dominance Metric
The liquidity of the crypto market shows how easily participants can buy and sell assets without significantly affecting their price. To assess the sustainability of demand, it is necessary to consider not only market capitalization but also trading volumes of cryptocurrencies, spreads, and the depth of the order book.
Two crypto assets with comparable capitalization can differ significantly in the number of available buy and sell orders. If there are not enough counter offers, even a relatively small operation can cause a sharp change in value. Therefore, the growth of individual altcoins with low trading volumes does not necessarily indicate a recovery of the broader market.
Additional information is provided by spot volumes, the difference between buy and sell prices, and the distribution of orders in the order book. These indicators help assess how actively participants are willing to make deals and whether the market can absorb large orders.
The method of executing a trade is also of practical significance. For example, on the crypto exchange TRADEX, market and limit orders are provided. A market order is intended for execution at available counter offers, while a limit order allows setting a maximum price for the trade. With insufficient liquidity, a market order may execute with slippage, and a limit order may only partially execute or not execute at all.
The state of liquidity should also be considered in the context of broader market demand. In a November study by Glassnode, it was noted that the average Coinbase premium remained negative. This meant that Bitcoin was trading on Coinbase at a discount relative to the chosen comparison market, but the indicator itself did not allow measuring the absolute volume of buying demand.
At the same time, the presence of buy orders in the order books of Binance and Coinbase showed that potential interest in the asset had not completely disappeared. However, placed orders can be canceled before execution, so even significant order book depth does not guarantee the preservation of liquidity amid sudden market changes.
More details on the relationship between spot demand, ETFs, and liquidations were discussed by UNUM in the article “Why Bitcoin is Falling and the Role of ETFs, Liquidations, and Demand”.
What Signals Can Confirm the Start of Altseason
The current structure of the crypto market allows for several possible developments. The decline in Bitcoin's dominance may continue amid the strengthening of altcoins, but a scenario is also possible where the capitalization of most digital assets remains under pressure.
The most informative approach will be to simultaneously monitor several indicators:
BTC Dominance and Ethereum Dominance. A decline in BTC's share while ETH and other major cryptocurrencies' capitalization steadily grows may indicate expanding demand beyond Bitcoin.
Altcoin Season Index. Reaching a CoinMarketCap index value of 75 points or more indicates a broad relative outperformance of altcoins over the considered 90 days.
Altcoin capitalization excluding stablecoins. Its steady growth will allow distinguishing the real increase in the sector's market value from changes caused by BTC's capitalization decline.
Stablecoin supply. A resumption of positive dynamics in USDT, USDC, and other major assets may indicate improved dollar liquidity conditions, although it does not guarantee increased demand for cryptocurrencies by itself.
Spot volumes and market depth. An expansion of trading activity while maintaining sufficient liquidity will make a potential recovery more convincing than price increases on small volumes.
The combination of these signals will be particularly important. If Bitcoin's share continues to decrease while altcoin capitalization rises, their relative returns improve, and trading volumes recover, the basis for discussing the development of an altseason will become significantly stronger.
Conversely, further reduction in stablecoin supply and overall capitalization with weak spot demand will more likely correspond to a scenario of declining market activity. Even in this case, individual projects may show positive returns, but their growth should not automatically be extended to the entire sector.
What Bitcoin Dominance Decline Means for the Crypto Market
The November decline in Bitcoin's share shows how ambiguous one of the most popular indicators of the cryptocurrency market has become. The relative weakening of BTC is not necessarily accompanied by an inflow of funds into altcoins, especially when overall capitalization remains under pressure and stablecoin supply decreases.
Available data points to a combination of several processes: changes in the relative value of assets, cautious behavior of participants, and weakening of certain capital inflow channels. Therefore, it is premature to speak of a confirmed start of an altseason solely based on the decline in BTC Dominance.
Future dynamics will primarily depend on whether demand can spread to a wide range of cryptocurrencies. For assessing this process, the combination of capitalization, relative returns, stablecoin supply, and trading liquidity is more important than the movement of a single indicator.