
What happened to Bitcoin over the past week
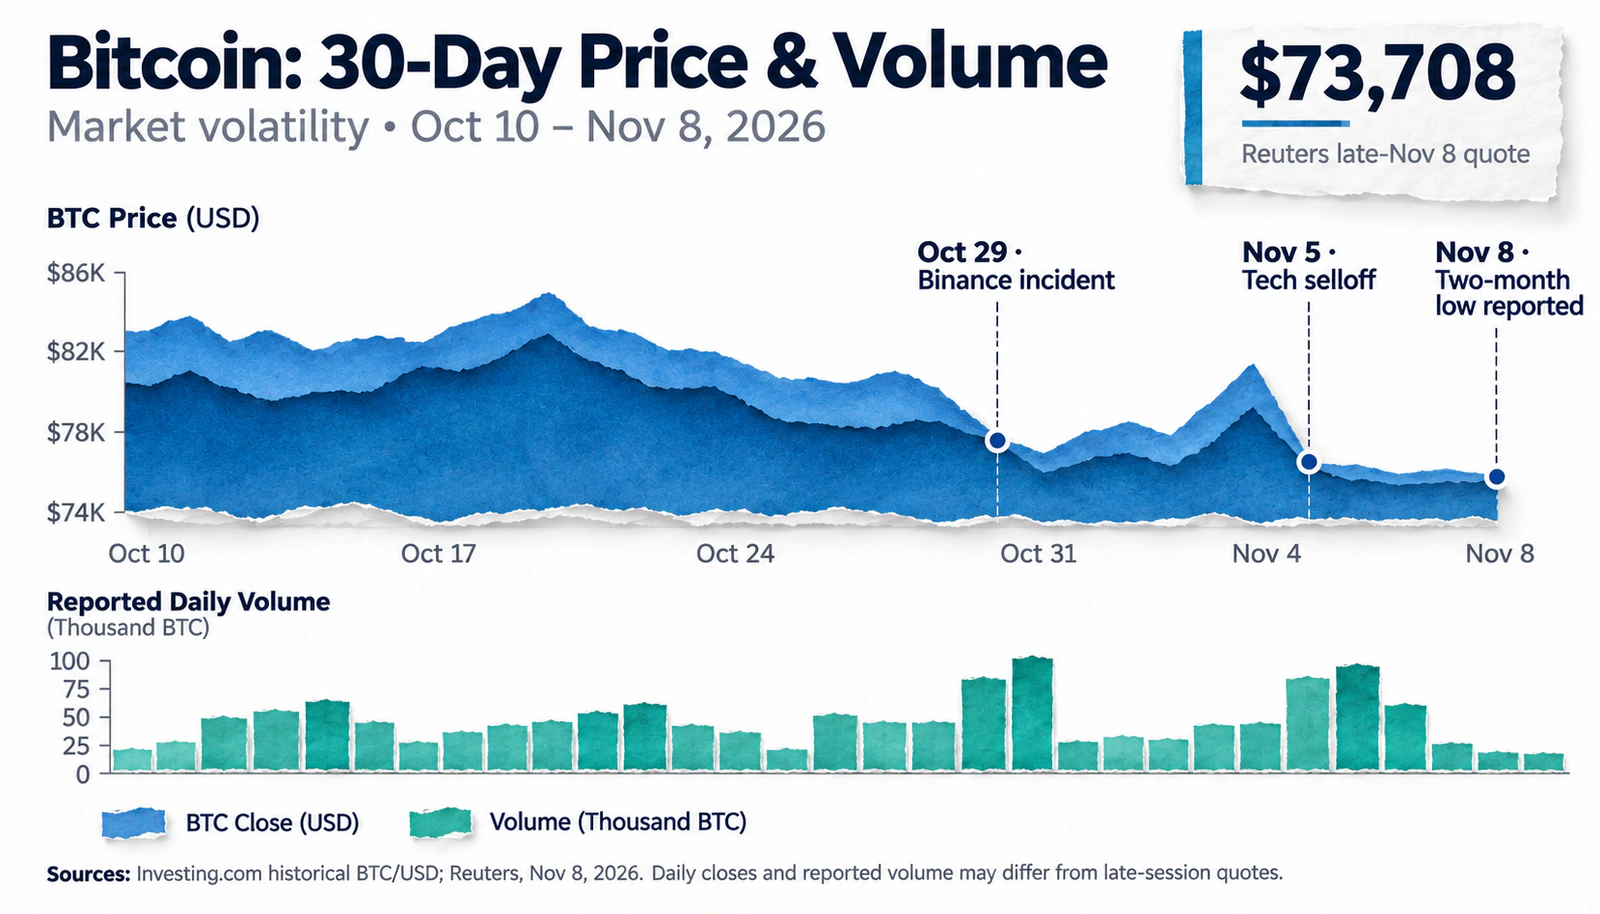
Late in the evening of November 8, Bitcoin (BTC) dropped to $73,708, losing more than 2% of its value. According to Reuters, this was the lowest level since August 2026. Simultaneously, Ethereum (ETH) fell by about 5% to $2,223. For both cryptocurrencies, the decline continued the instability observed in the market during previous trading sessions.
The pressure gradually increased. After the Binance hack on October 29, the crypto market faced additional uncertainty, and in early November, US spot Bitcoin ETFs recorded significant capital outflows. The situation was complicated by the sell-off of US tech stocks amid investors reassessing the prospects of companies related to artificial intelligence and semiconductor production.
However, the price movement was not continuous. After a brief recovery above $80,000 on November 4, Bitcoin's rate fell below $76,000 the next day. This dynamic shows how quickly market participants' sentiments were changing.
The timing of the latest decline is particularly significant. Bitcoin reached a two-month low on Sunday when US stock exchanges and spot Bitcoin ETFs were not trading. Therefore, the drop cannot be solely attributed to new ETF operations on the same day. Previous changes in demand, trading on 24/7 crypto exchanges, and forced position closures could have influenced the price.
Current price dynamics, trading volumes, and key network indicators can be tracked on the Bitcoin (BTC) page at UNUM.
Outflows from Bitcoin ETFs increase market pressure
One of the signs of weakening demand for Bitcoin through regulated investment instruments has been capital outflows from US spot ETFs. These funds allow investors to access cryptocurrency through traditional exchange products, so changes in cash flows help assess interest in BTC from stock market participants.
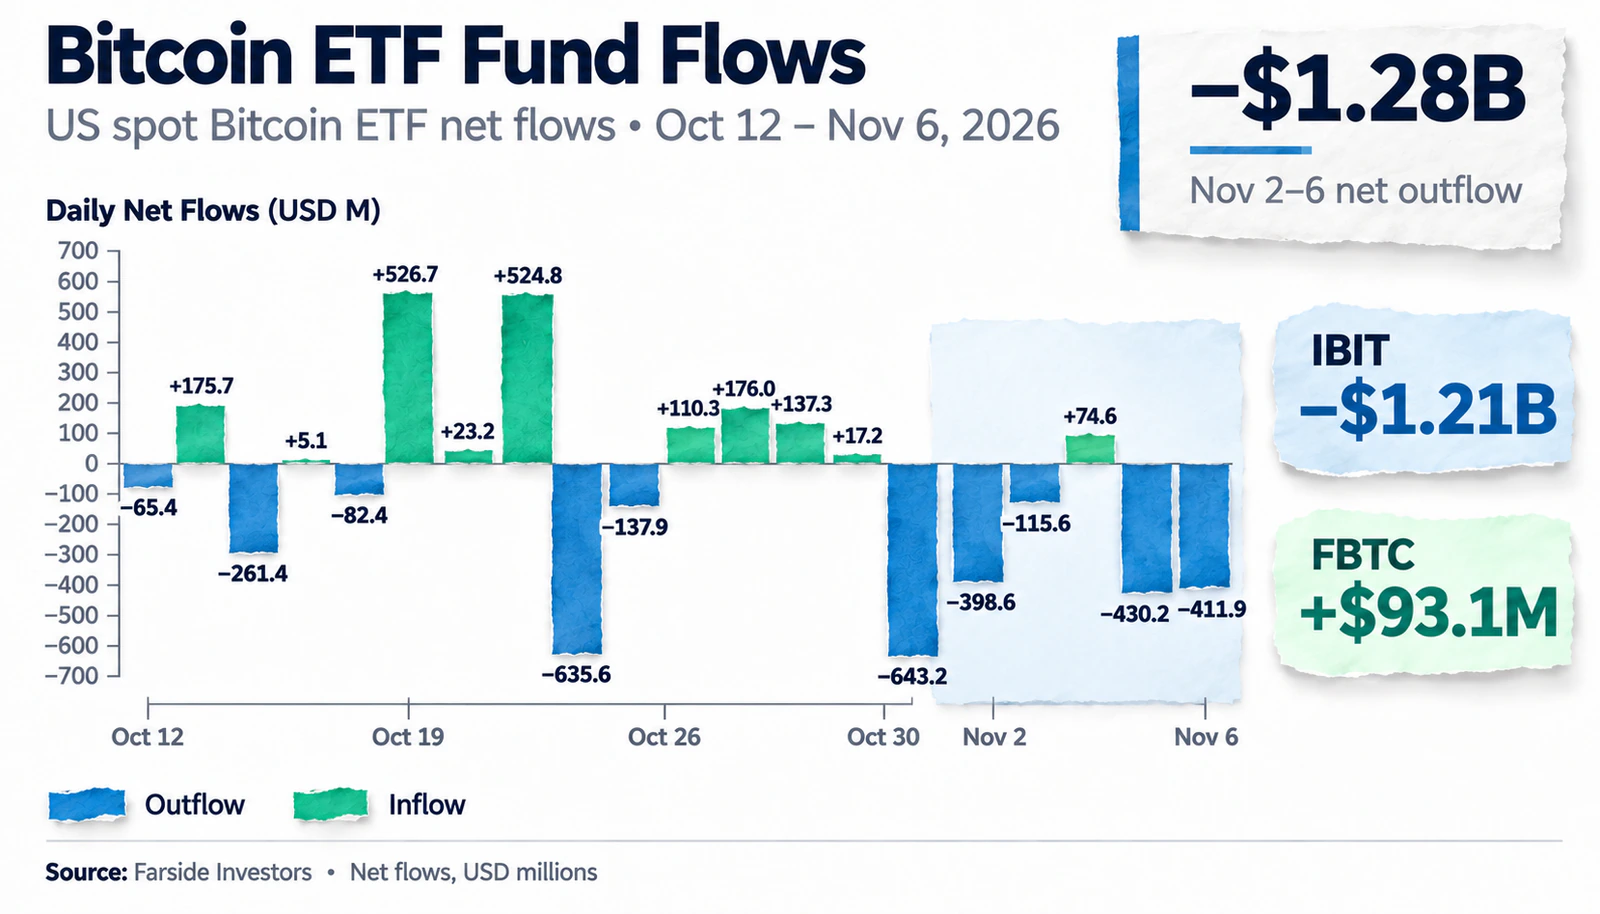
According to Farside Investors statistics, from November 2 to 6, 2026, US spot Bitcoin ETFs recorded a total net outflow of $1.28 billion. The most significant reductions occurred on November 5, when funds lost $430.2 million, and on November 6, with an additional outflow of $411.9 million.
The dynamics of BlackRock's iShares Bitcoin Trust (IBIT) were particularly notable. Over five trading sessions, the fund's net outflow reached approximately $1.21 billion. Meanwhile, the Fidelity Wise Origin Bitcoin Fund (FBTC) attracted about $93.1 million during the same period.
The differences between fund results indicate that capital movement within the Bitcoin ETF segment was uneven. Some products faced significant reductions in investments, while others continued to receive funds. Therefore, assessing the entire market's condition based solely on the largest fund's results would be incorrect.
Previously, UNUM reported on outflows from Bitcoin and Ethereum ETFs totaling $530 million on November 5. New data confirm that the negative flow dynamics of Bitcoin ETFs continued into the next trading session.
However, it is important to consider the mechanism of fund operations. Net outflow reflects capital changes through the creation and redemption of ETF shares but is not equal to the total volume of Bitcoin sales on all crypto exchanges. Moreover, these data do not allow for pinpointing which transactions directly caused price changes at a specific moment.
Thus, outflows indicate a weakening of demand through an important regulated investment channel but do not explain the full depth and speed of BTC's decline.
Futures liquidations may have accelerated BTC's fall
In addition to spot market operations, Bitcoin's price depends on the activity of derivatives market participants. Futures and perpetual contracts allow for leveraged positions, increasing potential profits but also heightening the risk of forced trade closures.
During a sharp price decline, this mechanism can amplify the initial movement. When the collateral value of a position falls below a set level, the trading platform may automatically close it. If such operations occur en masse, they can create additional market pressure.
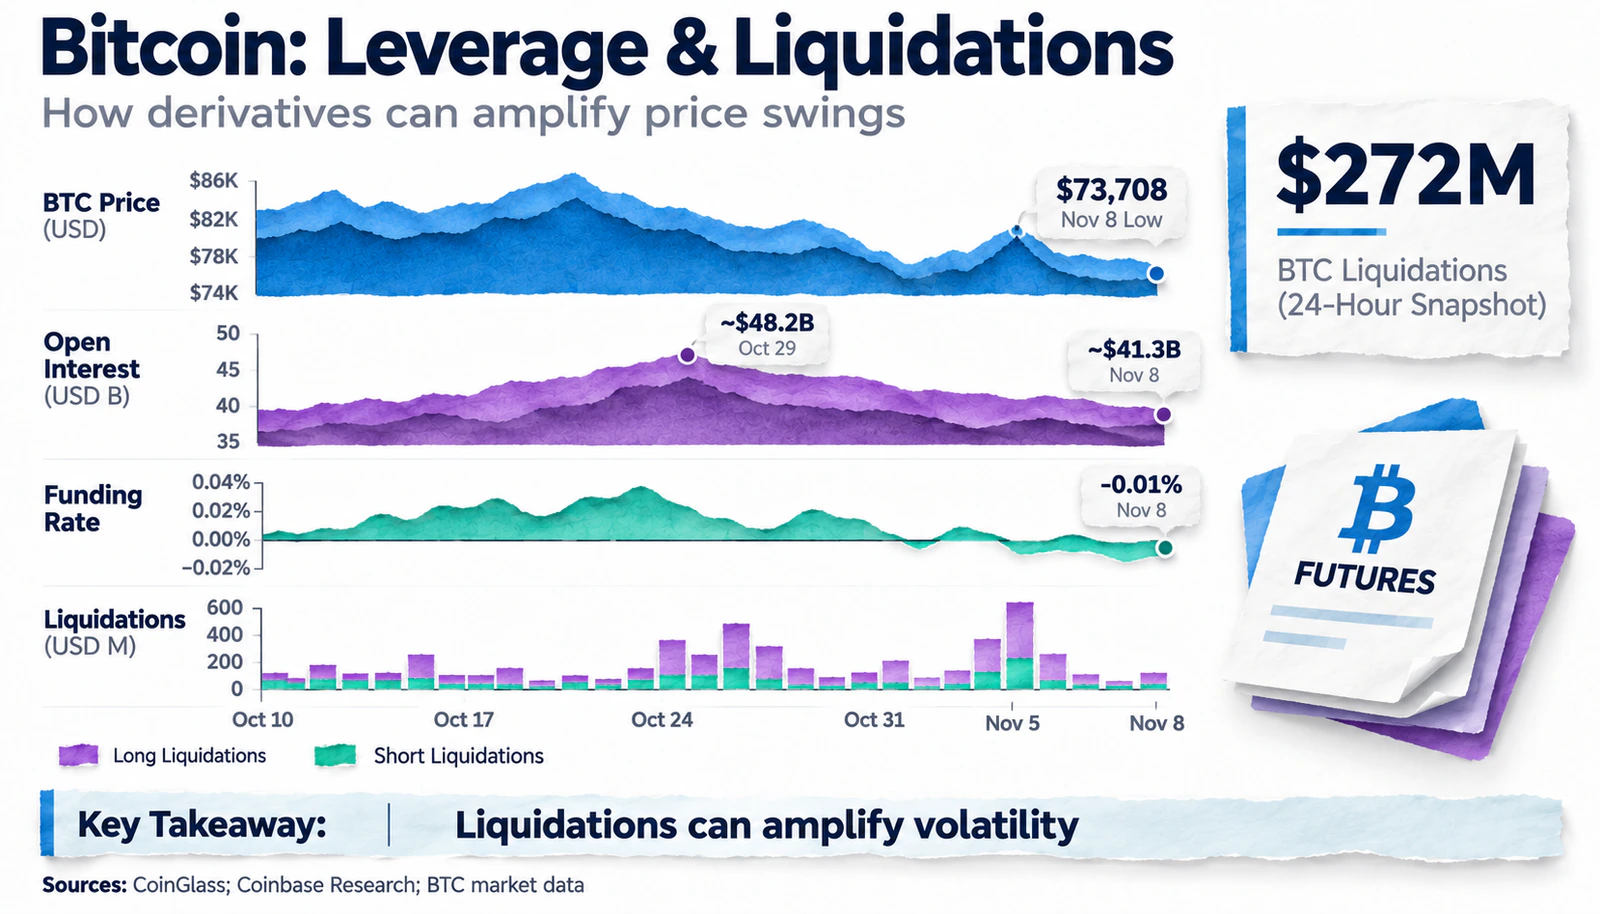
According to CoinGlass data cited by CoinDesk in a publication on November 8, U.S. time, positions worth over $1 billion were liquidated in the previous 24 hours amid sharp cryptocurrency fluctuations. Approximately $913 million were long positions opened in anticipation of price increases. Of the total liquidations, about $272 million were related to Bitcoin, and $448 million to Ethereum.
The scale of liquidations indicates that forced position closures accompanied sharp market fluctuations and could further amplify price movements. However, the volume of liquidations should not be equated with the net sales volume on the spot market. Some operations occur within the derivatives segment, and the impact on the underlying asset is transmitted through hedging and trading platform interactions.
Signs of increased market vulnerability were observed even before the November decline. In a Coinbase Research study from November 2, it was noted that the average funding rate for perpetual BTC contracts, annualized, was about 8.9% from October 25 to 31. At the beginning of October, the rate was approximately 4%.
A positive funding rate usually means that holders of long positions pay participants who have opened short positions. Its increase may indicate the rising cost of holding long positions, although it does not in itself prove excessive use of leverage.
Colin Baskow, senior quantitative strategist at Coinbase Research, noted: “It is not entirely clear to us that the recent increase in BTC leverage reflects market participants' confidence…”.
The analyst explained his doubts by the fact that the increase in leverage was not accompanied by convincing support from spot BTC holders and the options market.
Two indicators are particularly important for assessing the current state of derivatives — open interest and the funding rate. The former reflects the volume of open contracts, while the latter helps assess the demand ratio for long and short positions in perpetual futures.
If a price decline is accompanied by mass liquidations and a reduction in open interest, it may indicate a decrease in leveraged positions. However, a drop in open interest does not necessarily mean forced liquidations. Participants may close contracts voluntarily, and changes in open interest in dollar terms are partly related to the movement of the underlying asset's price.
Spot Demand for Bitcoin Remains Ambiguous
To understand how sustainable Bitcoin's decline might be, it is necessary to evaluate not only ETFs and derivatives but also regular cryptocurrency trading on spot platforms.
Unlike futures contracts, spot market transactions involve the direct purchase or sale of an asset. Therefore, trading volumes, order book depth, and the ratio of aggressive buys and sells help assess actual participant activity.
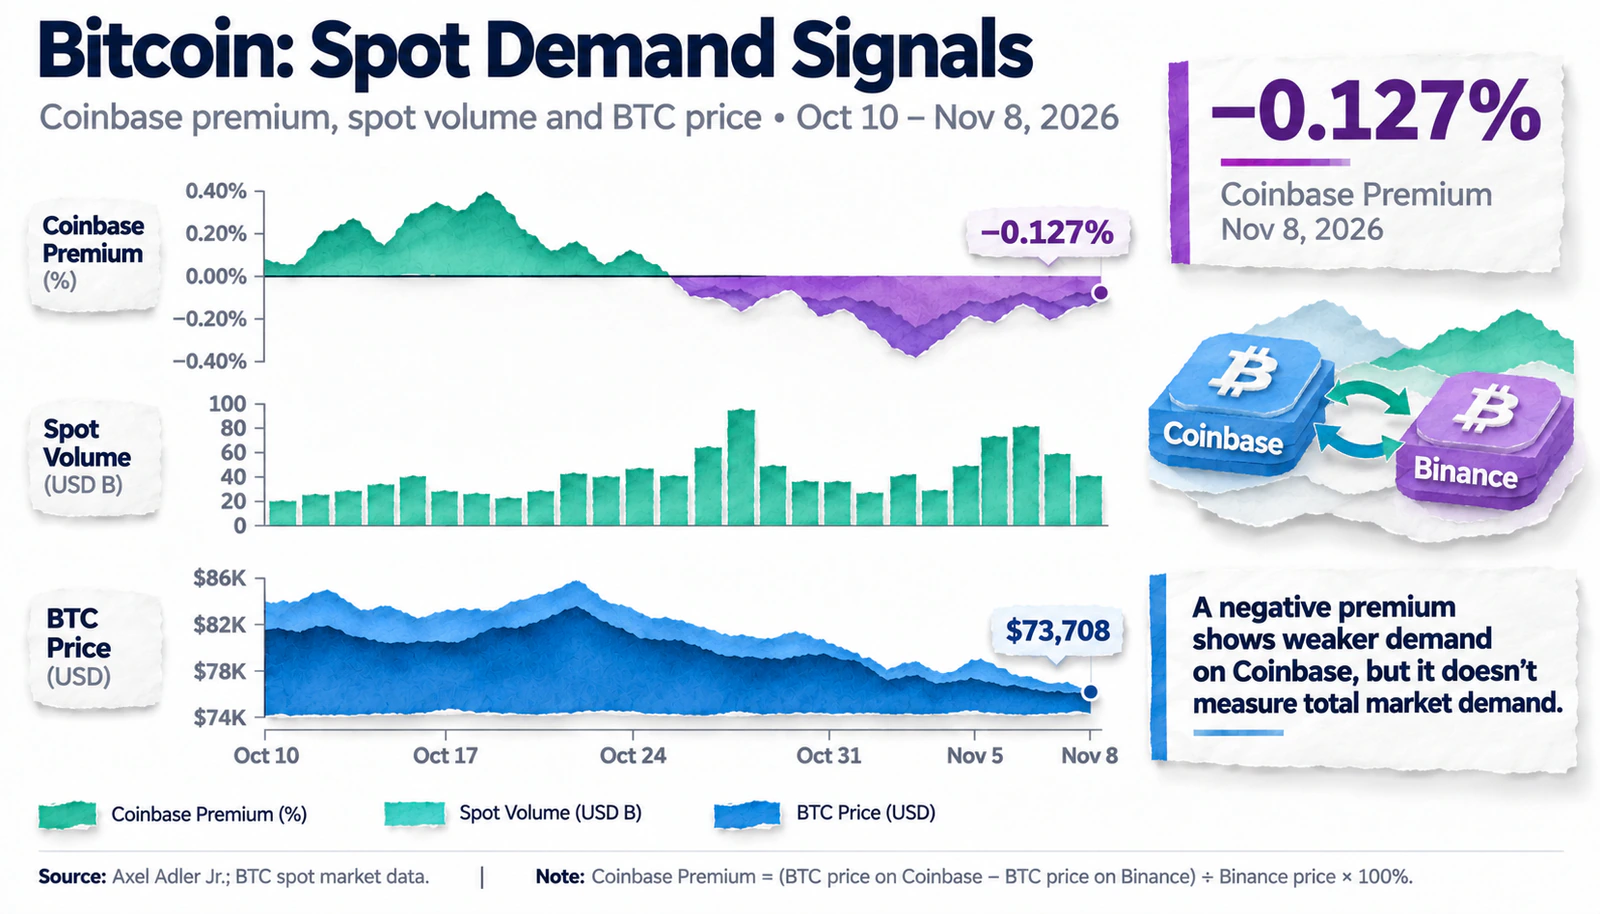
One additional indicator is the Coinbase Premium Index. In the methodology used by analyst Axel Adler, it reflects the percentage difference between the BTC/USD price on Coinbase and Bitcoin quotes on Binance. A positive premium means the cryptocurrency is trading higher on Coinbase, while a negative premium indicates it is cheaper relative to the chosen comparison platform.
According to Axel Adler's data, on November 8, the Coinbase Premium Index was −0.127%, or approximately −0.13%. Over the previous 30 days, the indicator in his series also remained negative.
A negative premium indicates a relative discount for BTC on Coinbase but does not independently assess the total volume of buying demand on the platform. Price differences are influenced by exchange liquidity, trading pair structure, and arbitrage speed. Additionally, premium calculation methodologies may differ among data providers.
The picture becomes more complex when examining market depth. According to Coinbase Research, in October, the average depth of buy orders for BTC within 5% of the average market price increased by 11% compared to September, while the depth of sell orders decreased by 13%.
These data characterize the October structure of the exchange order book and do not confirm the market state directly on November 8–9. Nevertheless, they show that relative price premium and order distribution can give different signals.
Such discrepancies are explained by differences between indicators. The Coinbase Premium reflects the relative price of an asset on two platforms, while order book depth characterizes placed liquidity, which can change or disappear before trades are executed.
An additional analysis tool is the Cumulative Volume Delta (CVD). It shows the difference between the volumes of aggressive buys and sells over a certain period. A sustained decline in CVD during a BTC drop could confirm the dominance of active sellers, while a recovery in the indicator could help assess the emergence of counter demand.
Therefore, it is premature to speak of the complete disappearance of interest in Bitcoin. Available data indicate the weakness of certain demand channels, but to assess the entire spot market, it is necessary to compare indicators from several crypto exchanges.
How Bitcoin's Decline is Linked to the Tech Stock Sell-Off
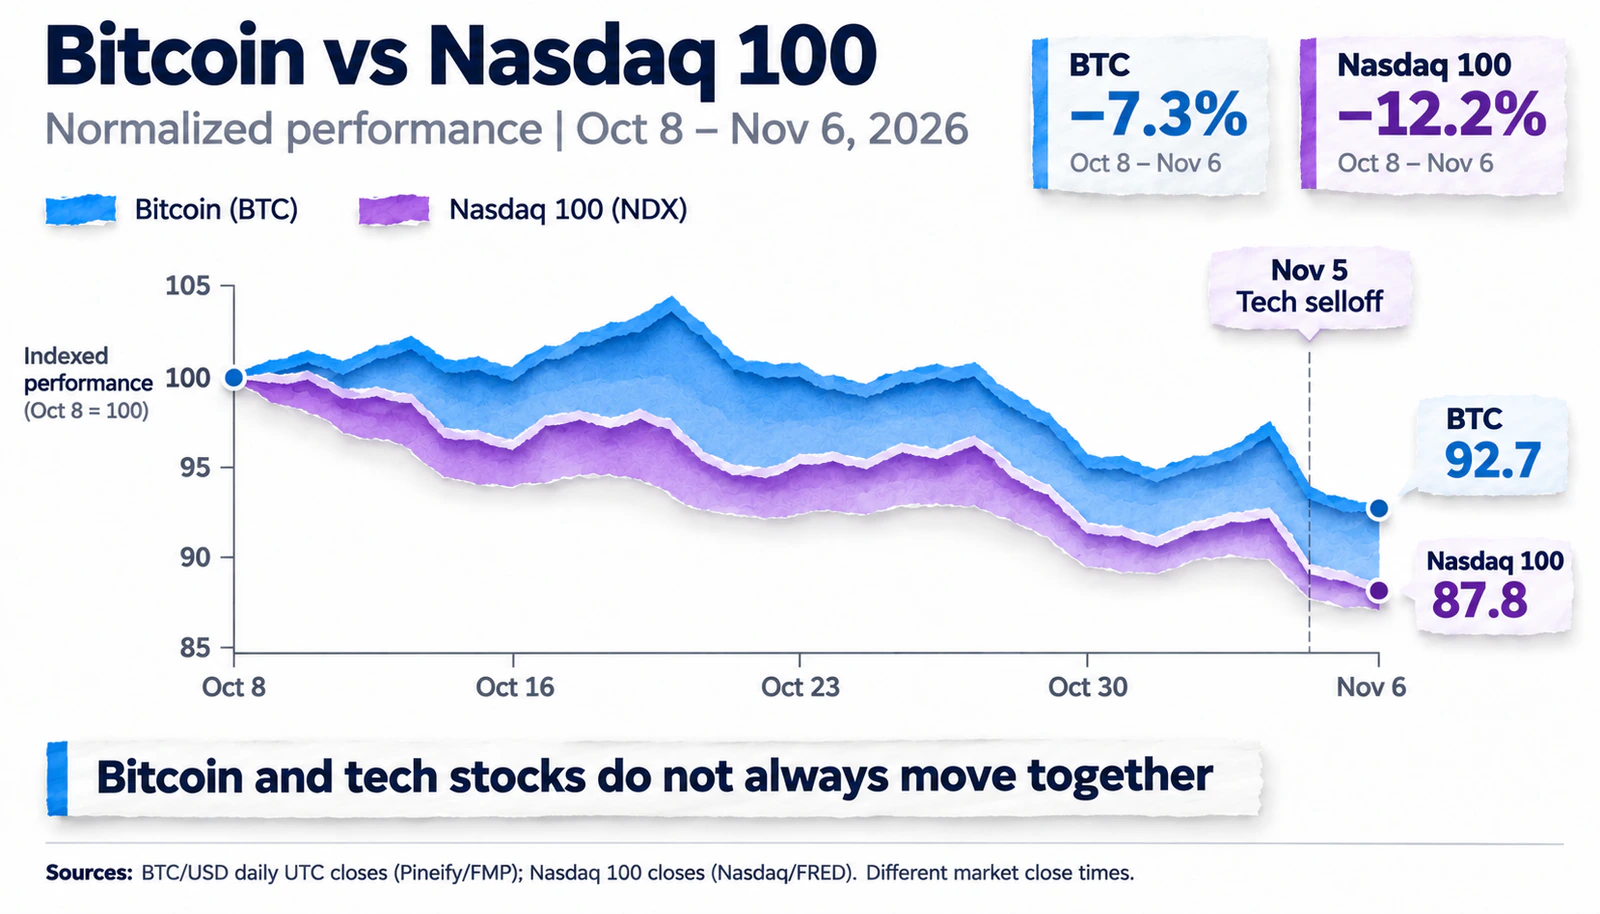
The decline in cryptocurrencies coincided with a worsening situation in the U.S. stock market. According to Reuters on November 6, the Nasdaq Composite index lost about 3.4% over the week, marking its fourth consecutive week of decline.
A particularly strong sell-off was observed on November 5. The Nasdaq Composite fell by 5.5%, while the Nasdaq 100, which has a higher concentration of major tech companies, lost about 6.4%. During the same period, Bitcoin dropped below $76,000.
Such a coincidence allows BTC to be viewed in the context of a general reduction in risk appetite. When investors reassess the prospects of costly tech projects, the expected returns on assets, and the cost of financing, pressure can simultaneously spread to both stocks and cryptocurrencies.
An additional factor was the expectations regarding U.S. monetary policy. Strong U.S. labor market data for October heightened assumptions about a possible Fed rate hike in December. According to Reuters, after the publication of the statistics, the probability of a rate hike priced into the market was approximately 78%. This assessment reflected market participants' expectations as of November 6 and could change in subsequent trading sessions.
For Bitcoin, this is significant because tighter monetary policy can limit investors' willingness to increase positions in volatile assets. However, the impact of interest rates is not mechanical. It depends on market expectations, dollar dynamics, and how much new data is already priced in.
You can follow the publication of important macroeconomic indicators in the UNUM economic calendar.
However, it cannot be assumed that Bitcoin simply mirrors Nasdaq movements. The cryptocurrency trades around the clock, including weekends, and its price additionally depends on the state of its own derivatives market, exchange liquidity, and specific industry risks.
Recent incidents include the Binance hack on October 29. Hackers stole crypto assets worth approximately $6.3 billion. Some of the funds were later frozen, but the incident heightened attention to the security of major trading platforms.
Another source of uncertainty was the political and regulatory expectations following the U.S. midterm elections. Reuters reported concerns among some market participants about potential tightening of cryptocurrency regulation. However, these expectations should be distinguished from already enacted legislative decisions. A change in Congress composition does not itself imply the introduction of new restrictions.
Thus, the tech stock sell-off coincided with worsening market sentiment in cryptocurrencies. Industry events and liquidations could also have amplified BTC fluctuations, but the contribution of each factor is not quantitatively established.
What Signals Can Help Assess Bitcoin's Future Movement
After BTC fell to two-month lows, the key question is not only whether the price has reached a local bottom, but also how sustainable demand will be during a recovery attempt.
For this, it is useful to simultaneously monitor several indicators reflecting different market segments:
Bitcoin ETF flows. A reduction in outflows or a return to sustainable capital inflows may indicate improved demand through regulated investment products.
Open interest and funding rate. Their dynamics help determine whether price movement is accompanied by the accumulation of new leveraged positions or a gradual reduction of market overload.
Spot volumes and Coinbase Premium. An increase in buying activity across multiple platforms can serve as additional confirmation of demand recovery, especially if it does not rely solely on futures trades.
Based on the combination of these indicators, three scenarios for further development can be outlined.
Scenario | Important Signals | Possible Interpretation |
|---|---|---|
Stabilization | ETF outflows decrease, spot demand improves, funding rate remains moderate | The market gradually restores balance without a sharp increase in leverage |
Unstable Rebound | BTC rises, but ETFs continue to lose capital, and open interest increases rapidly | Recovery may depend primarily on speculative positions |
Continued Decline | ETF outflows persist, weak spot demand, and new waves of liquidations | Seller pressure remains significant, and conditions for sustainable recovery have not formed |
These scenarios are not a forecast of specific price levels. Their purpose is to show what changes in market indicators may confirm or weaken various explanations for Bitcoin's movement.
Particular attention should be paid to the area around $73,700, where a two-month low was recorded on November 8. A return to this level may trigger a reaction from participants focusing on previous extremes. However, considering it confirmed support without analyzing trading volumes and subsequent dynamics is premature.
What Determines Bitcoin's Direction Now
The drop in Bitcoin to $73,708 cannot be attributed to a single cause. Outflows from U.S. spot ETFs indicate a weakening of demand through a regulated investment channel, and the scale of liquidations confirms that the derivatives market may have amplified volatility. Simultaneously, a negative Coinbase Premium and the sell-off of tech stocks point to additional signs of tension, although none of these indicators alone establishes a direct causal link.
Available data rather suggest a combination of reduced demand, closing of leveraged positions, and worsening investor risk sentiment, rather than highlighting a single defining factor.
For assessing the sustainability of the next BTC movement, the structure of the rebound from the two-month low is more important than the fact itself. If the recovery is accompanied by improved spot demand and ETF flows without excessive leverage increase, it will provide more convincing grounds to speak of market stabilization. However, if growth is primarily driven by derivatives, the risk of a new wave of volatility remains.