In a material prepared by the UNUM editorial team with the partnership support of the crypto exchange TRADEX, we compare futures activity, spot demand for Bitcoin, ETF flows, and the behavior of coin holders.
Why Bitcoin's recovery raises questions
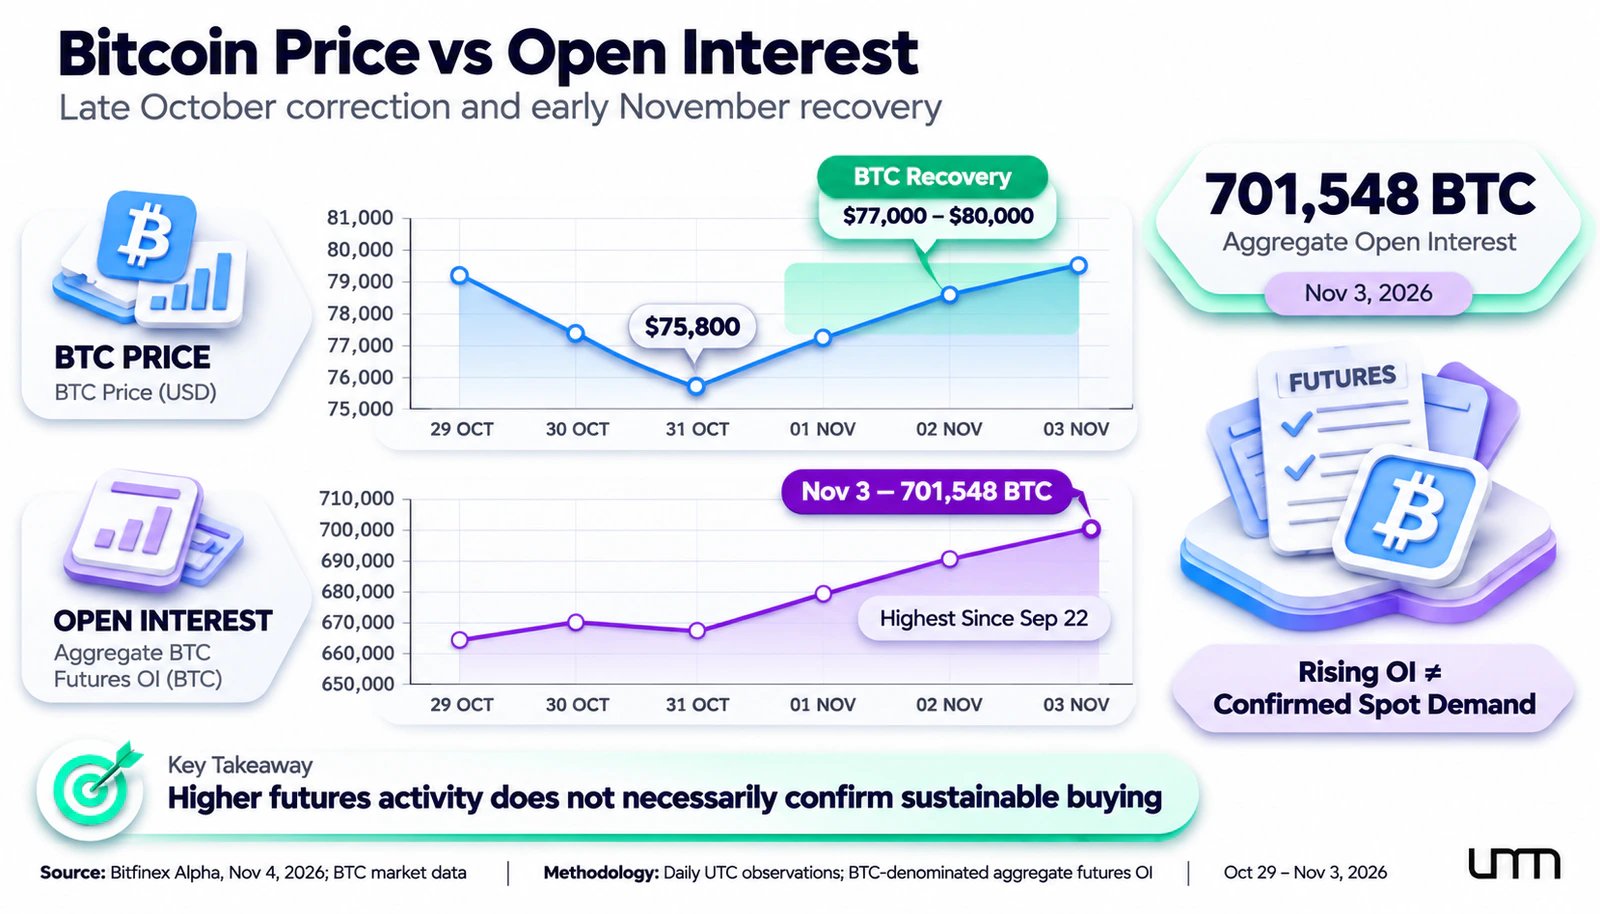
After the correction in late October and early November, Bitcoin (BTC) returned to the $77,000–80,000 range. However, prices may rise due to the closing of short positions and leveraged trades.
In the Bitfinex Alpha report from November 4, analysts link the initial support of quotes mainly to derivatives. This is an assessment, not a proven cause of the entire growth. A similar discrepancy between price and demand was explored by UNUM in October.
Open interest is growing but does not replace demand
As of November 3, BTC open interest (Open Interest, OI) reached 701,548 BTC — the highest since September 22. This is the volume of open futures contracts, each with long and short sides. An increase in OI does not prove the dominance of buyers.
Another indicator is the funding rate of perpetual futures. According to Bitfinex, it remained near 11% per annum for about two weeks, although on November 4 it briefly dropped to 4.1%. With a positive rate, holders of long positions pay shorts, and the high cost of such trades may indicate an overheated derivatives market. In the event of a price drop, liquidations can amplify the movement. This risk was considered by UNUM using the example of Binance.
What the spot market shows
In the spot market, participants buy BTC itself, while Bitcoin futures provide price exposure through a contract. Derivatives affect quotes through arbitrage, hedging, and liquidations. During a short squeeze, the closing of short positions can accelerate the rebound without a sustainable inflow of investors.
The balance of aggressive buying and selling helps to assess the Cumulative Volume Delta (CVD) — their cumulative volume difference. If the price rises without an improvement in spot CVD, the momentum may be fragile. Without data on specific exchanges and periods, CVD does not prove the reason for the rise.
Bitfinex analysts note: "Real spot demand is necessary to continue this rebound."
Why holders continue to sell
The on-chain indicator STH-SOPR, reflecting the profitability of coins moved by short-term holders (less than 155 days), was 0.994 on November 4. A value below one indicates realized losses on average for these operations. This situation persisted for six consecutive trading sessions.
According to Bitfinex, the distribution of supply by the last movement price of coins (URPD) also changed: the volume of BTC in the $77,000–80,000 range increased from 1.05 million to 1.28 million from November 1 to 4, while in the $81,000–84,000 zone it decreased by 92,000 BTC. This is consistent with the transition of coins from former holders to new ones but does not reveal their motives or the exact original purchase price.
The realized price of short-term holders, according to Bitfinex on November 4, was about $75,839. Losing this benchmark will increase the risk of seller pressure, but it does not guarantee a decline by itself.
What is happening with BTC-ETF flows
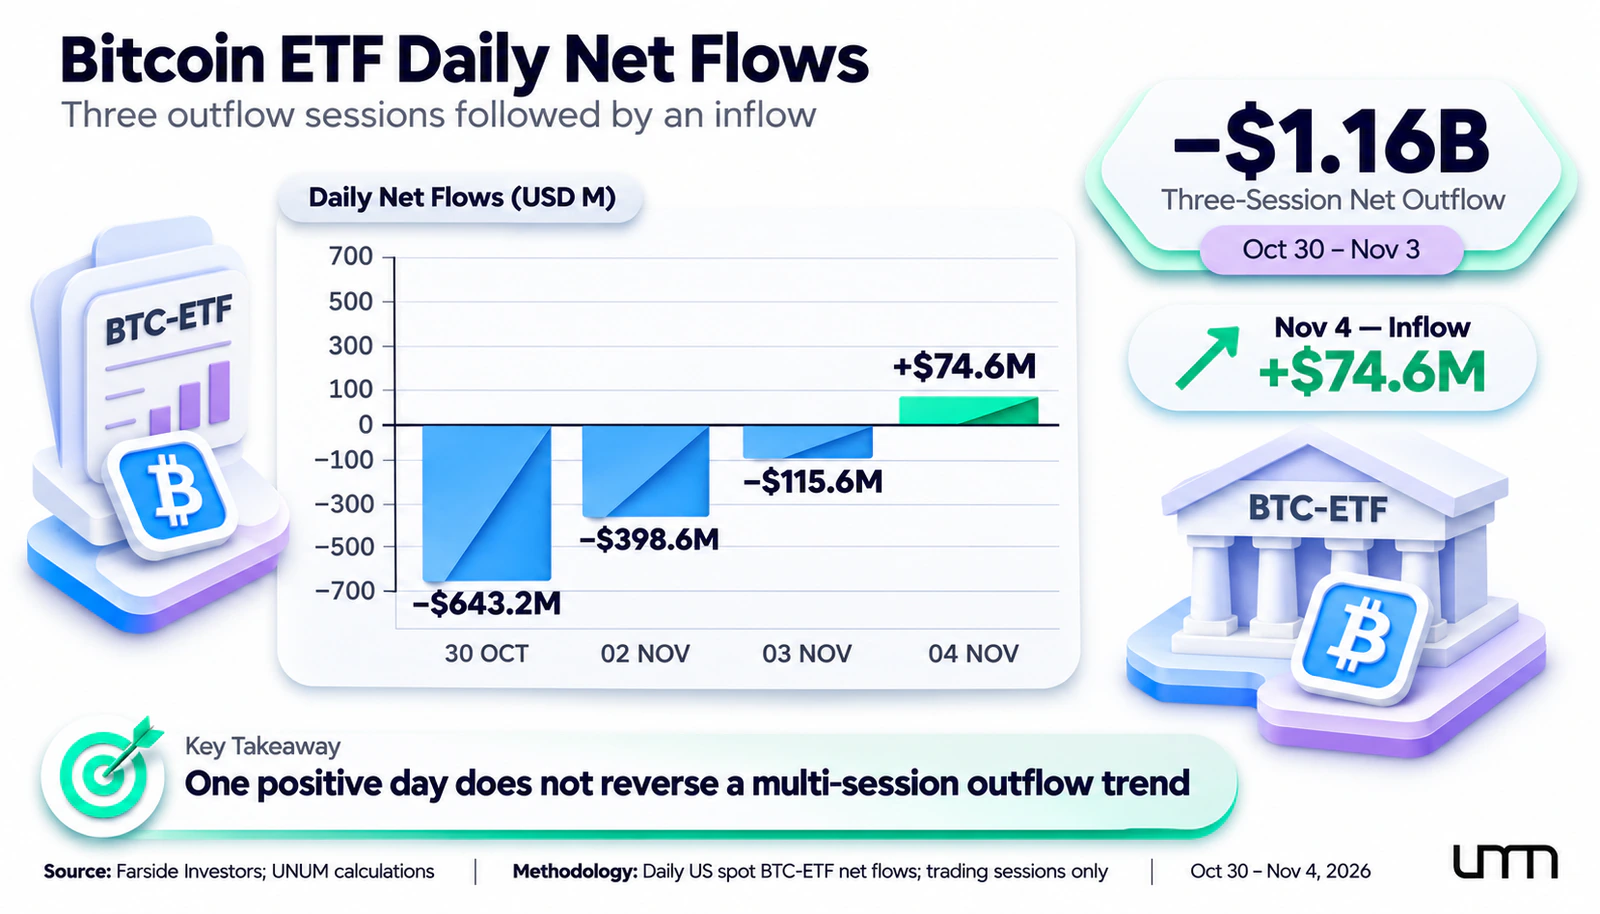
According to Farside Investors, U.S. spot BTC-ETFs recorded net outflows of $643.2 million, $398.6 million, and $115.6 million on October 30, November 2, and 3, respectively — totaling about $1.16 billion. This series was examined by UNUM in a separate news article.
On November 4, the funds showed a net inflow of $74.6 million, compensating for only a small part of the losses. For assessing sustainable demand, several consecutive sessions of inflows are more important than one positive day. ETF data does not allow distinguishing between institutional and retail buyers.
What scenarios are possible for BTC
The future course of Bitcoin depends on whether spot purchases confirm the recovery. In the November review of the crypto exchange TRADEX dated November 2, support at $76,500–77,000 and resistance around $82,000 are highlighted. These benchmarks should be compared with BTC trading volume and the state of the derivatives market, rather than being perceived as guaranteed targets.
There are three conditional scenarios possible for the upcoming sessions:
Strengthening growth. BTC consolidates above $81,300–82,000, CVD and spot volumes show increased buying, ETFs receive steady inflows, and the funding rate does not overheat.
Consolidation. The price remains between $75,839 and $80,200 while buying activity does not provide a convincing signal for continued recovery.
New decline. According to the Bitfinex scenario, closing the day below $75,839 with BTC's share in profit falling below 58% increases the risk of moving towards $70,000–75,000.
For Bitcoin analysis, it is important to track several metrics simultaneously.
Indicator | What to watch for |
|---|---|
Open Interest and funding rate | Leverage and cost of long positions |
Spot volumes and CVD | Strengthening aggressive buying |
BTC-ETF flows | Consistent fund inflows |
STH-SOPR | Return above one |
Bitcoin forecasts cannot be based solely on price or open interest. According to Bitfinex's assessment, the initial rebound was largely supported by derivatives, and the inflow into ETFs on November 4 does not yet confirm a sustainable return of demand. A more convincing signal would be the simultaneous improvement of spot indicators, fund flows, and on-chain metrics.