How Celo Surpassed Base with Significantly Lower Liquidity
According to the analytics platform growthepie, in the 30 days up to October 25, 2026, the Celo network recorded 21 million stablecoin transactions compared to 11.59 million for Base. Thus, Celo processed 81% more transactions, with this advantage persisting over several weeks.
In the last seven days, Celo registered 4.84 million transactions compared to 3.03 million for Base, and in the last 24 hours — 671,900 versus 355,700. This leadership by Celo in this metric was observed earlier, so the October statistics confirm the stability of the discrepancy rather than indicating a sudden change in leadership.
The distribution of capital between the networks looks entirely different. The value of stablecoins placed in Base as of October 25 reached $4.94 billion. The last confirmed value for Celo as of October 24 was $153.16 million. Thus, Base held approximately 32 times more capital expressed in stablecoins.
Metric | Celo | Base |
|---|---|---|
Daily Stablecoin Transfers | 671,900 | 355,700 |
Transfers in 7 Days | 4.84 million | 3.03 million |
Transfers in 30 Days | 21 million | 11.59 million |
Value of Stablecoins in Network | $153.16 million* | $4.94 billion |
Gas for Stablecoin Transactions in 30 Days | $96,700 | $20,500 |
Number of Tracked Stablecoins | 35 | 67 |
Source: growthepie, data as of October 25, 2026, except for Celo's stablecoin value as of October 24. The number of assets is determined by the platform's classification and may differ from other aggregators' figures. Values for 7 and 30 days are presented as rolling sums.
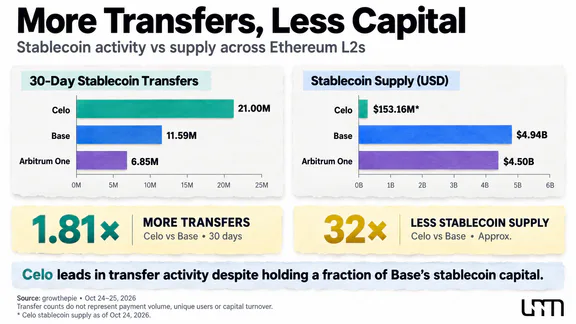
The discrepancy is explained by differences between liquidity and transactional activity. The capitalization of stablecoins in the network reflects the value of assets held within it, but does not show how frequently they are used for transfers. This metric should not be confused with TVL, which characterizes the value of assets locked in DeFi protocols.
A network may rank first in the volume of stablecoins placed but only fifth in the number of transactions.
However, the number of transfers also does not reflect the entirety of economic activity. For a fundamental assessment, it is necessary to consider the monetary volume of transactions, the number of users, fees, and the nature of applications driving demand.
Why Celo Users Are So Actively Transferring Stablecoins
The differences between networks are largely due to their specialization. The Celo blockchain was initially developed as a mobile infrastructure for affordable financial services, and after transitioning to Ethereum Layer 2 in 2025, it maintained its focus on everyday payments.
One of the key applications in the ecosystem became Opera MiniPay — a cryptocurrency wallet that allows storing and transferring digital dollars, as well as using integrated financial services.
In the MiniPay report for Q3 2026, published on October 20, the team revealed accumulated metrics since the product's launch:
More than 20 million wallet activations.
Over 600 million transactions processed.
More than $2.3 billion in total processed volume.
Presence in more than 70 countries and 77 active Mini Apps.
These are the metrics of the application for its entire existence, not just the statistics of stablecoin transfers for the quarter. Wallet activations are also not equivalent to the number of unique users.
Nevertheless, the report shows what usage scenarios the ecosystem is developing. MiniPay provides access to international transfers, payment cards, purchasing digital assets, and settlements in national currencies. For example, the integrated Sonny Pay application allows making purchases through supported local QR payment systems in the Philippines, Vietnam, Brazil, Argentina, and Peru.
An additional advantage of Celo is the Fee Abstraction mechanism, which allows paying network fees with stablecoins, including USDT and USDC. Users do not need to purchase CELO in advance for each operation, simplifying the use of the payment infrastructure.
The significant contribution of MiniPay to on-chain activity is also confirmed by the growthepie research, published in March 2026. At that time, the application accounted for approximately 45% of all transactions and 93% of the stablecoin flow in Celo. These historical values cannot be automatically transferred to October, but they show how much the network's activity depends on a single user product.
It is also necessary to consider incentive programs. According to the Opera report, in Q3, about 386,000 CELO were distributed to the company's browser users as part of the rewards program. Additionally, MiniPay Boost encourages holding USDT and using the wallet.
Such mechanisms can support transactional activity, so to assess organic demand, it is important to determine how much users continue to make transactions without additional incentives. The existence of rewards does not prove the artificial nature of growth but requires considering their impact on statistics.
Why billions of dollars in Base did not ensure leadership in transfers
A high number of stablecoin transfers in Celo does not mean that Base lags in overall activity. On the contrary, the Base network remains one of the most loaded in Ethereum L2.
According to growthepie statistics, on October 25, Base processed about 7.53 million transactions per day, ranking first among tracked second-layer networks by this metric.
Base serves a broader ecosystem of applications, including decentralized exchanges, lending protocols, token trading, and other financial services. In such a model, stablecoins are used not only for payments but also as collateral, a settlement asset, and a source of liquidity.
For example, USDC can be placed in a lending protocol and provide open positions for a long time. Meanwhile, the capital continues to perform an economic function, even if the number of transfers is relatively small.
Liquidity infrastructure also continues to develop. As UNUM reported, in October, Uniswap introduced Aggregator Hooks, expanding access to liquidity from external platforms, including in Base.
Another indicator of differences is active addresses. Earlier, UNUM wrote, that on October 22, their number in Base increased by almost 50%, although the number of transactions and fees paid decreased.
This example shows why the growth of active addresses cannot automatically be considered an expansion of the real audience. One person can manage multiple wallets, and incentive programs can temporarily increase the number of addresses used.
Consequently, Celo leads in a certain category of operations, while Base maintains an advantage in the total number of transactions and the value of stablecoins placed. For an objective comparison, it is necessary to consider differences in the structure of demand.
Can millions of transfers be considered real payments
A large number of stablecoin operations does not prove that users have paid for goods or sent money to others millions of times.
USDT, USDC, and other stablecoins are used for trading, lending, arbitrage, collateral movement, and transfers between own wallets. Additionally, one blockchain transaction with a smart contract can include multiple token transfer events and other actions.
In the study The Anatomy of Stablecoin Transactions, published by the Bank for International Settlements on June 11, 2026, the authors analyzed about 593 million records of smart contract events within 141 million Ethereum transactions involving USDT, USDC, and PYUSD.
Researchers found that nearly 60% of transfer events occur within complex transactions. These results are based on Ethereum data and do not allow us to assert that a similar share of complex operations is characteristic of Celo or Base. However, they show how misleading it can be to equate all stablecoin transfers with standalone payments.
To verify real payment activity, it is necessary to further study the average and median transfer amounts, unique senders and recipients, repeatability of operations, and concentration of activity in specific applications.
The total cost of payment is also important. A low blockchain fee does not guarantee cheap conversion into national currency, as UNUM explained in the article “Stablecoins Are Not as Cheap as They Seem”.
Therefore, Celo's advantage in the number of transfers should be viewed as an indicator of infrastructure use rather than proof of similar superiority in monetary turnover or the number of real purchases.
Do millions of transfers bring income to the network itself
For a fundamental assessment of the blockchain, it is important not only the number of operations but also the economic value they create.
According to growthepie, in the 30 days leading up to October 25, users spent about $96,700 on gas in stablecoin operations in Celo and $20,500 in Base. If you divide these amounts by the number of corresponding operations, it comes to approximately $0.0046 per operation in Celo and $0.0018 in Base.
This is a calculated average for a specific category of transactions, not a universal transfer cost in the respective network.
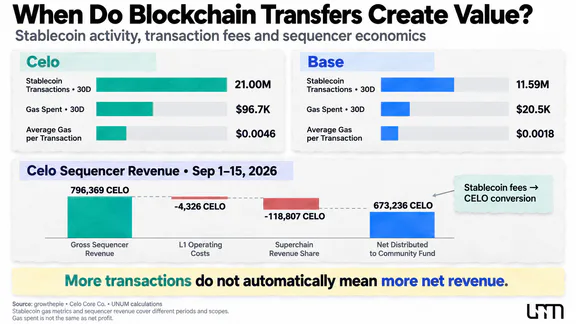
The fees paid by users cannot be automatically equated to the network's net profit. The L2 economy also includes costs for data publication and settlements in Ethereum, sequencer operation, and other infrastructure expenses.
For CELO holders, it is especially important to know how much the growth in activity contributes to increasing demand for the token.
In 2026, Celo began regularly directing net sequencer revenues to the Community Fund. According to the Celo Core Co. report, for the period from September 1 to 15, the gross revenue of the sequencer amounted to 796,369 CELO in estimated terms.
Of these, 437,210 CELO came directly in the form of fees, and another 359,159 CELO corresponded to stablecoin revenues amounting to about $28,067, converted into CELO. After deducting operating expenses and the share of revenue provided by Superchain agreements, 673,236 CELO were transferred to the Community Fund.
Thus, the current mechanism provides the following sequence:
User fees → conversion of stablecoin receipts into CELO → coverage of infrastructure expenses → transfer of net income to the Community Fund.
This confirms the economic link between network usage and programmatic demand for CELO. However, the inflow of tokens into the Community Fund is not equivalent to a direct income payment to each holder. Further use of funds is determined by ecosystem governance mechanisms.
Moreover, the presented report includes sequencer revenues from different categories of operations. It cannot be directly compared with the gas indicator paid exclusively for stablecoin transfers over the past 30 days.
Consequently, even with increased transactional activity, the fundamental value of CELO depends on commission volumes, network expenses, revenue distribution, token supply, and market demand.
What indicators are now important for investors when evaluating blockchains
The comparison of Celo and Base shows that fundamental analysis of cryptocurrencies cannot be built around a single ranking. High TVL or significant stablecoin volume reflects the scale of capital but not necessarily the frequency of its use. The number of transactions characterizes network load but does not always allow for an assessment of real economic demand.
For a more objective analysis, investors should compare four groups of indicators:
Network Usage. The number of transactions, monetary volume of transfers, and the number of unique active addresses help to understand whether the blockchain's activity is expanding or if only the intensity of existing participants' operations is increasing.
Quality of Activity. It is necessary to study which applications create transactional demand and how much it depends on incentive programs. Concentration of activity in one major product can increase the network's dependence on its development.
Infrastructure Economy. Blockchain revenue from user fees should be compared with expenses, rather than being perceived as a ready indicator of profitability. It is also important to determine whether low fees are supported by a sustainable technological and economic model.
Connection with the Token. Even a demanded network does not necessarily create proportional investment demand for the associated asset. It is necessary to consider tokenomics, supply, buyback and burn mechanisms, revenue distribution, and the economic rights of token holders.
For Celo, sustainable development will be confirmed by a combination of high transaction frequency with an increase in monetary turnover, user base, and payment scenarios beyond MiniPay.
For Base, a comprehensive assessment of DeFi activity, liquidity depth, settlement volumes, and the infrastructure's ability to generate revenue from various applications is more important.
Practically, this means that investors should analyze the dynamics of several independent indicators over 30–90 day intervals. Even coordinated improvement of on-chain metrics does not replace the assessment of the token's market value and acquisition risks.
What Celo's Victory Says About the Future of Blockchains
Celo indeed surpassed Base in the number of stablecoin transactions, despite having a much lower value of placed assets. However, this does not make Celo the unconditional leader of Ethereum L2 and does not mean that liquidity has lost its significance.
The networks serve different needs: one specializes in frequent user payments, while the other has more extensive liquidity and a broader infrastructure of financial applications.
The main takeaway for investors is that the success of a blockchain should be evaluated through the nature of its use, the sustainability of demand, and the infrastructure's ability to create economic value. It is important to distinguish between the network's revenue and the mechanisms for transferring this value to specific token holders.