
Why Nasdaq Fell by 5.5% in a Day
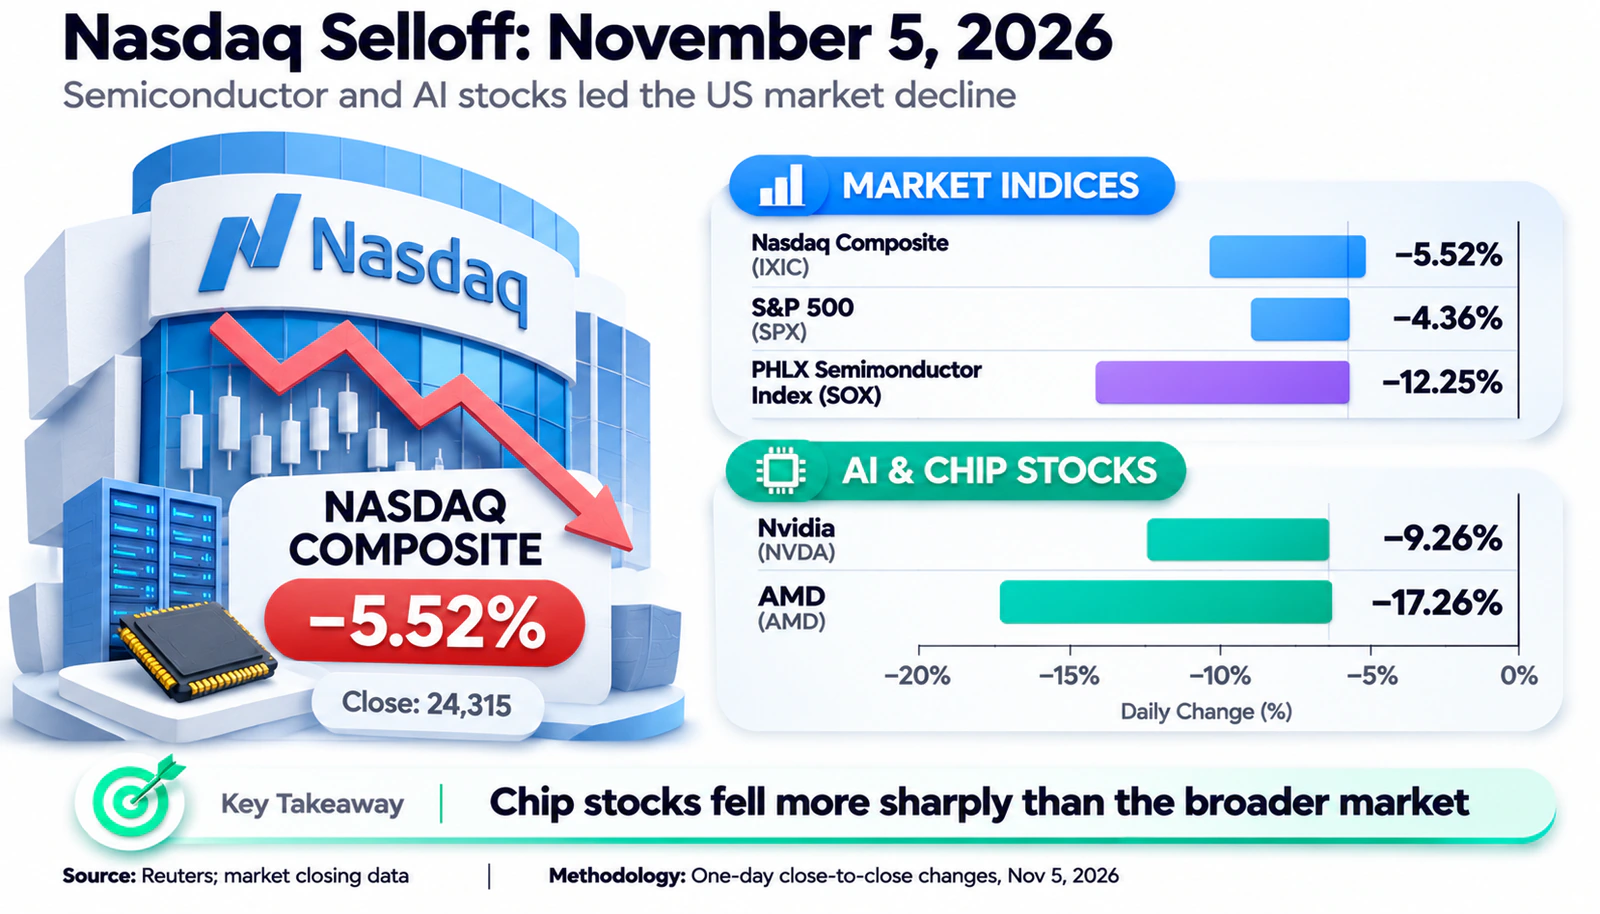
On November 5, 2026, the US stock market experienced one of the largest sell-offs in recent months. The Nasdaq Composite index fell by 5.52% to 24,315 points, the S&P 500 lost 4.36%, and the Nasdaq 100, which includes the largest non-financial companies trading on Nasdaq, dropped by about 6.4%.
The greatest pressure was on semiconductor manufacturers and companies related to artificial intelligence infrastructure. Nvidia shares fell by 9.26%, AMD lost 17.26%, and the Philadelphia Semiconductor Index, which tracks the semiconductor sector, declined by more than 12%.
According to Reuters, Nasdaq ended trading more than 10% below its October peak, entering a technical correction. The combined market capitalization of companies in the S&P 500 shrank by approximately $3 trillion in one session.
One of the factors behind the sell-off was concerns about the future of data center construction in the US. According to Reuters, the results of the midterm elections heightened investor worries about potential tightening of AI infrastructure regulations. However, this is about market expectations rather than actual restrictions being implemented.
Melissa Brown, head of research for investment solutions at SimCorp, noted in a comment to Reuters: “...any slowdown would raise concerns, as the growth story of the AI sector has largely relied on the rapid construction of necessary infrastructure.”.
The decline also reflected a reassessment of expectations regarding the return on large-scale investments in artificial intelligence. When investors begin to doubt the future profitability of tech projects, even companies with growing revenues may face a decline in stock value.
Why the Sell-Off of AI Stocks Affects Bitcoin
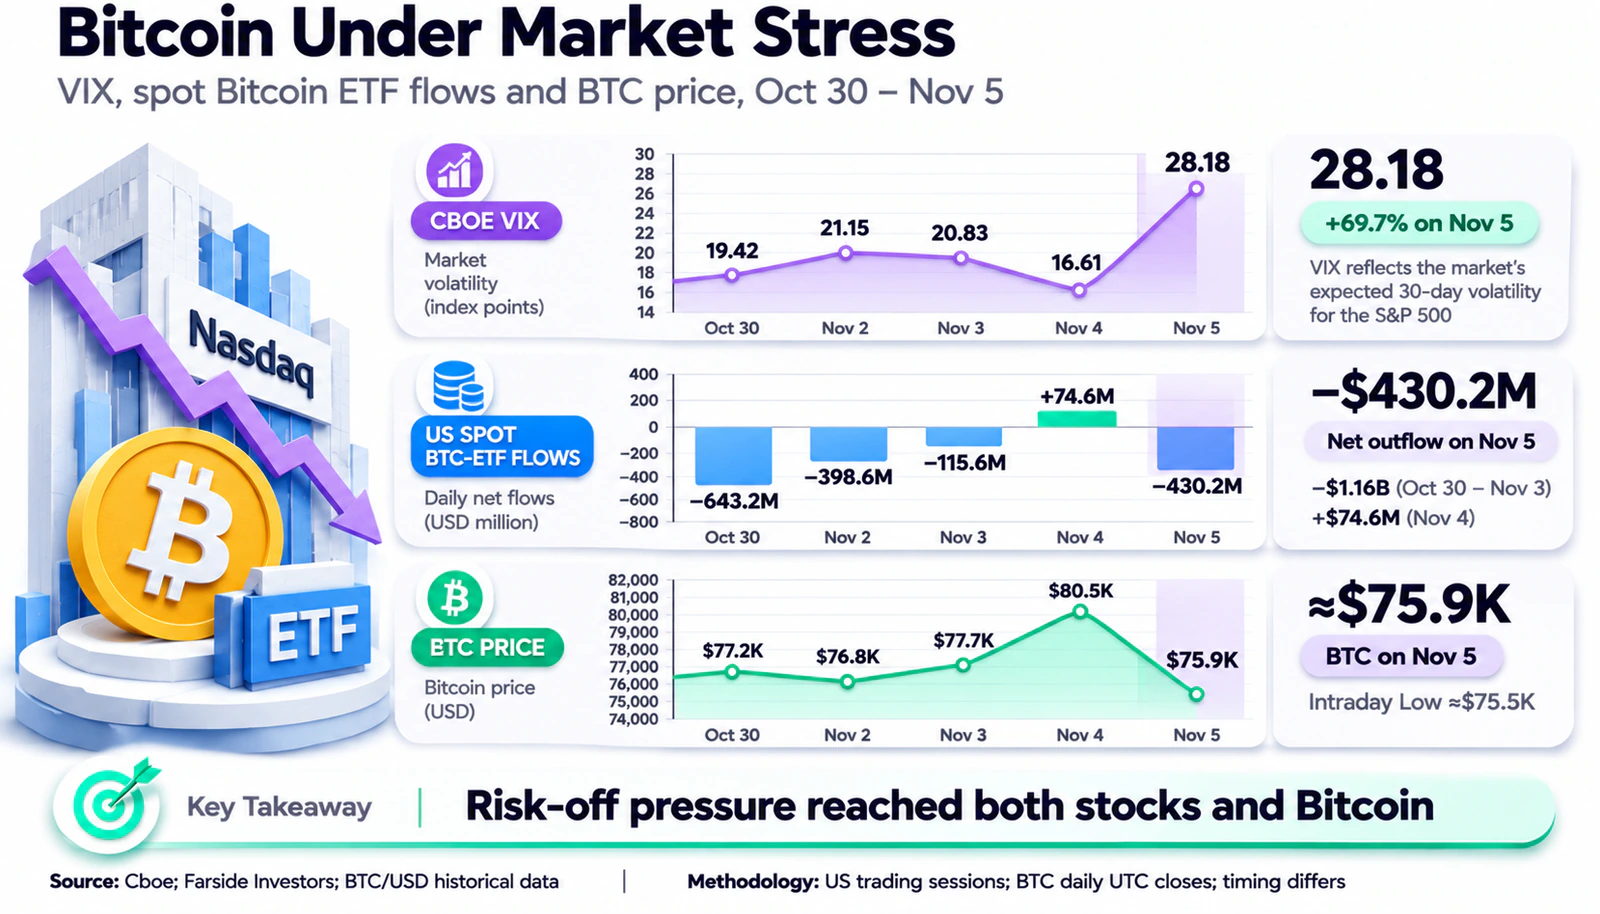
Amid the decline in US indices, the price of Bitcoin (BTC) fell by more than 6% intraday on November 5, reaching approximately $75,500. By the end of the US stock session, Bitcoin was trading around $76,000 after a recent recovery above $80,000.
BTC itself does not depend on Nvidia's profits, processor sales volumes, or data center construction. The connection arises through the behavior of investors who operate in both the stock and cryptocurrency markets.
The main channels of pressure transmission are three factors:
Reduced investor risk appetite. When participants expect further stock declines, they may reduce investments in other volatile assets, including cryptocurrencies.
Deterioration of financial conditions. High borrowing costs, uncertainty around Fed interest rates, and reduced market liquidity can simultaneously limit demand for tech stocks and BTC.
Selling assets to cover obligations. During sharp market fluctuations, participants using leverage may need additional collateral, sometimes forcing them to close positions in various instruments.
Thus, Nasdaq's influence on Bitcoin is primarily through changes in market sentiment and liquidity, rather than a direct dependency of BTC on the financial results of tech companies.
The state of the crypto market itself also matters. In UNUM's analysis on Bitcoin's rise in futures, it was noted that BTC's recovery in early November was largely supported by derivatives, while sustainable spot demand remained in question.
This structure makes the market more vulnerable to sharp movements, especially when external deterioration coincides with the liquidation of leveraged positions.
How Dependent is Bitcoin on Nasdaq
The correlation of Bitcoin with stocks allows for assessing the strength and direction of the linear statistical relationship between the returns of two assets. However, this indicator does not establish a causal relationship and does not guarantee the observed pattern will continue in the future.
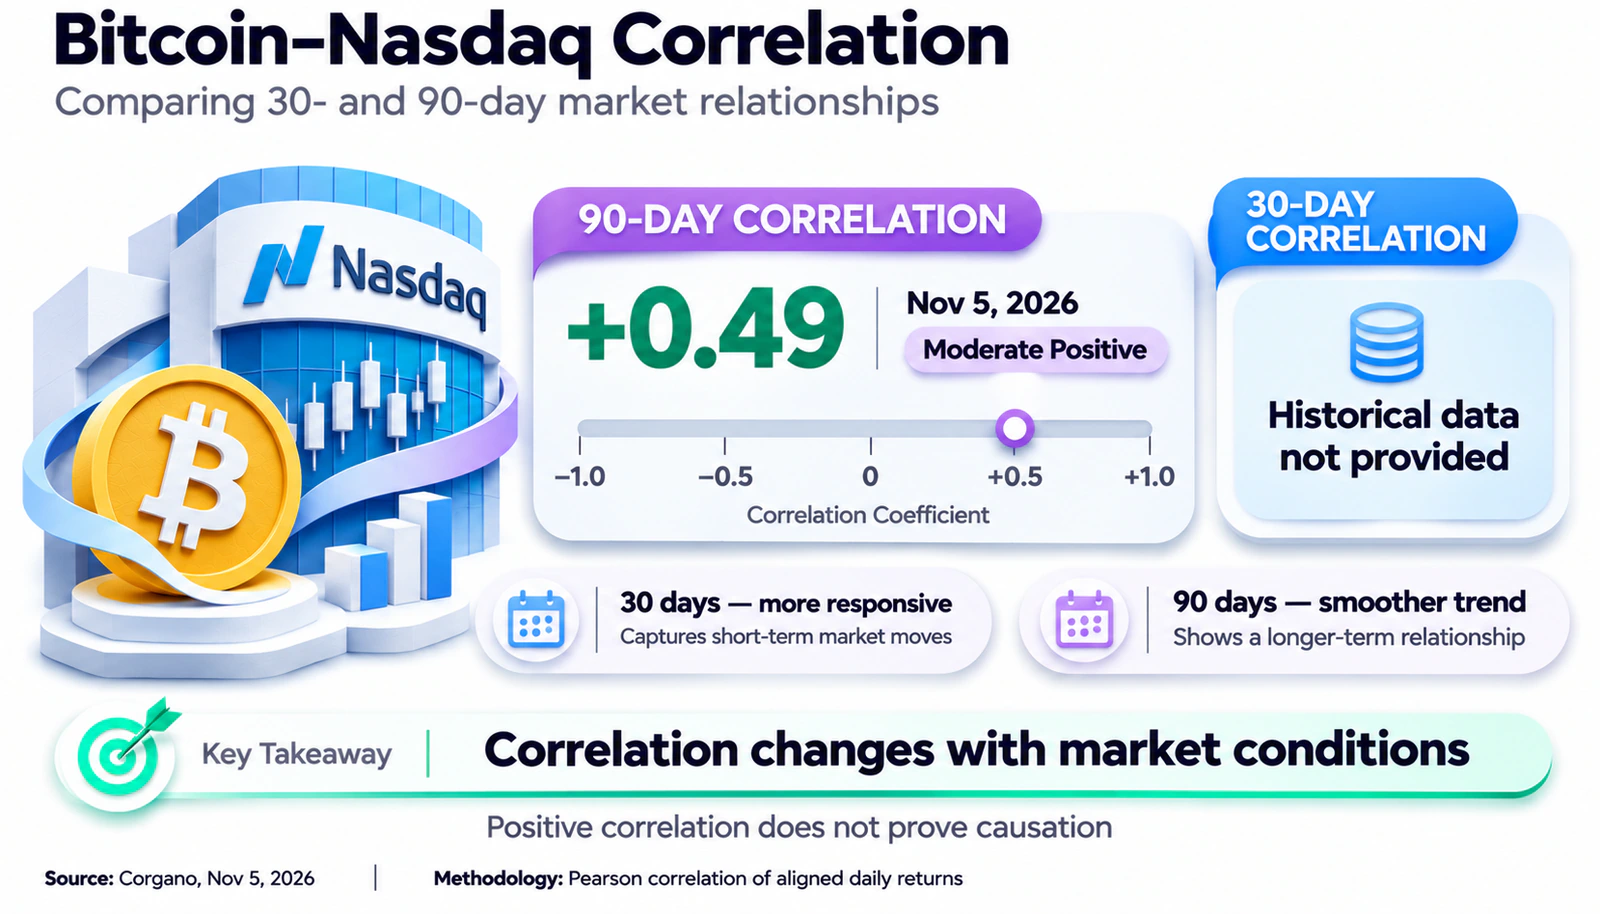
According to calculations by the analytical service Corgano, as of November 5, the correlation between BTC and Nasdaq over the last 90 joint trading days was approximately +0.49. This is a moderate positive correlation, where the movements of the two markets often coincide, although they remain far from identical.
For comparison, in 2022, the annual correlation reached approximately +0.59, whereas in 2019, it was around −0.10. Historical values show that the degree of Bitcoin's dependence on the stock market changes with financial conditions and investor behavior.
When interpreting, it is important to consider the calculation methodology. Bitcoin is traded around the clock, while American stocks are mainly within the exchange session. Different price fixation times and sample durations can significantly change the coefficient. For example, Corgano uses BTC quotes at 00:00 UTC and stock market closing prices.
It is especially useful to compare the correlation over 30 and 90 trading days. The first indicator responds more quickly to changes in market behavior, while the second helps assess a longer-term trend.
For investors, this means that holding BTC in a tech stock portfolio does not guarantee protection from a general sell-off. When Bitcoin's correlation with stocks strengthens, the portfolio diversification opportunities through cryptocurrency may decrease.
What VIX, Bitcoin ETF, and Futures Market Show
To assess Bitcoin's prospects after Nasdaq's decline, it is not enough to only observe the BTC price. Additional information is provided by the VIX volatility index, capital flows into exchange-traded funds, and the state of the crypto derivatives market.
VIX Shows Sharp Increase in Uncertainty
On November 5, the Cboe VIX volatility index rose from 16.61 to 28.18 points, gaining almost 70% during the session. During the day, the indicator reached 28.36 points.
VIX reflects the expected volatility of the S&P 500 over the next 30 days, calculated based on option prices. Its rise is usually accompanied by increased demand for protection against sharp market fluctuations.
However, the VIX index does not measure BTC volatility directly and does not allow determining the direction of cryptocurrency movement. It rather indicates stock market tension, which can spread to other risky assets.
Outflows from Bitcoin ETF Limit Market Support
American spot Bitcoin ETFs also faced capital reduction. According to Farside Investors, over three trading days from October 30 to November 3, the net outflow reached $1.16 billion.
On November 4, the funds received a net inflow of $74.6 million, but on November 5, they recorded a new outflow of $430.2 million. Thus, the short-term improvement in indicators did not turn into a sustainable recovery in demand.
UNUM previously examined the previous series of outflows in the material on the withdrawal of $1.16 billion from Bitcoin ETF.
Outflows themselves do not prove that long-term investors are massively reducing their investments in Bitcoin. They reflect the net capital movement through ETFs but do not allow determining exactly which operations were performed by institutional investors and which by private participants. However, a prolonged series of negative values may indicate a weakening of one of the important sources of demand.
Leverage Amplifies BTC Fluctuations
In the crypto derivatives market, it is necessary to consider open interest, funding rates of perpetual futures, and liquidation volumes.
Open Interest shows the number of open contracts but does not allow determining whether buyers or sellers prevail. A positive funding rate means that long position holders usually pay shorts, and excessive use of leverage increases the risk of forced position closures.
If the Bitcoin price falls amid a reduction in open interest and mass liquidations of long positions, part of the movement may be associated with the exit of leveraged participants. At the same time, to assess market stability, it is important to check whether demand for spot BTC returns after liquidations.
When Bitcoin Can Move Independently of Tech Stocks
A positive correlation with Nasdaq does not mean that Bitcoin will forever remain dependent on the American stock market. Its value is also influenced by its own factors, including institutional demand, coin supply, holder activity, and the state of cryptocurrency infrastructure.
Divergence is possible if investors start returning to BTC regardless of the dynamics of the tech sector. For example, sustained inflows into Bitcoin ETF amid a continued Nasdaq decline may indicate the emergence of independent demand.
Another option is related to changes in macroeconomic conditions. If expectations for interest rates and liquidity become more favorable, Bitcoin may receive support even if AI company stocks continue to face pressure due to specific industry risks.
However, a single increase in the BTC rate does not yet indicate a weakening of dependence. More convincing signs will be several trading sessions of relative stability, an improvement in spot demand, and a decrease in short-term correlation.
Three scenarios for Bitcoin after Nasdaq crash
The Bitcoin forecast for the remainder of 2026 depends on the dynamics of Nasdaq, the state of liquidity, and the recovery of spot demand. Therefore, instead of a single price target, we will consider three possible scenarios for BTC movement.
Scenario | Conditions | Possible consequences for BTC |
|---|---|---|
Continued decline | Nasdaq remains under pressure, VIX stays at elevated levels, ETFs record outflows | Retesting the $75,000 zone and risk of moving to $73,200 |
Stabilization | Volatility decreases, stock sales slow down, ETF outflows reduce | Consolidation and attempts at recovery without a sustainable upward trend |
Independent recovery | Spot purchases return, ETFs show inflows, correlation with Nasdaq weakens | Potential for BTC growth even with weak tech sector dynamics |
The $75,000 level is of interest not only due to recent price declines. In a Reuters technical review on November 4, it was also highlighted as a potential support zone calculated using Fibonacci retracement. The next reference point was the 200-day moving average around $73,188.
Upon market recovery, attention may shift to the $81,300–82,000 area. In the Reuters review on November 4, the 30-day moving average was around $81,319, and the November TRADEX analysis highlighted resistance around $82,000.
These levels reflect the market state at the time of calculations and are not guaranteed boundaries for future movement. Their significance needs to be reassessed considering new quotes and changes in trading volumes.
What signals are important for investors and traders
After the sharp drop in Nasdaq, the key task is to determine whether overall pressure on risk assets persists or the market is transitioning to stabilization.
For this, it is advisable to monitor several indicators simultaneously:
Nasdaq 100 and SOX index. Further decline in tech stocks will show whether investors continue to reduce investments in the AI sector.
VIX index. A sustained decrease after a spike may indicate a reduction in stock market tension.
BTC and Nasdaq correlation. A change in the 30-day coefficient relative to the 90-day value will help assess whether Bitcoin's dynamics are becoming more independent.
Bitcoin ETF flows. Several consecutive days of net inflows will be a more convincing sign of demand recovery than a single positive session.
Spot volume, Open Interest, and Funding Rate. Their combination will determine how much the BTC rate change is supported by spot market purchases rather than predominantly leveraged positions.
To monitor the market, you can use Bitcoin quotes on UNUM and the stock indices section, comparing changes over the same time intervals.
What the Nasdaq decline means for Bitcoin prospects
The November 5 sell-off demonstrated that Bitcoin remains sensitive to changes in global risk sentiment. Despite its own market infrastructure, BTC can decline alongside tech stocks when investors reduce positions to mitigate portfolio risks.
However, a drop in the Nasdaq does not predetermine the future dynamics of cryptocurrency. It is more important to determine whether pressure on the stock market will persist, whether outflows from Bitcoin ETFs will continue, and whether spot demand can offset sales.
The main signal of changing BTC prospects will not be an isolated price rebound, but a combination of sustained demand, reduced reliance on short-term speculative positions, and stabilization of external financial conditions.