
Bitcoin ETFs lost $2.35 billion in two weeks
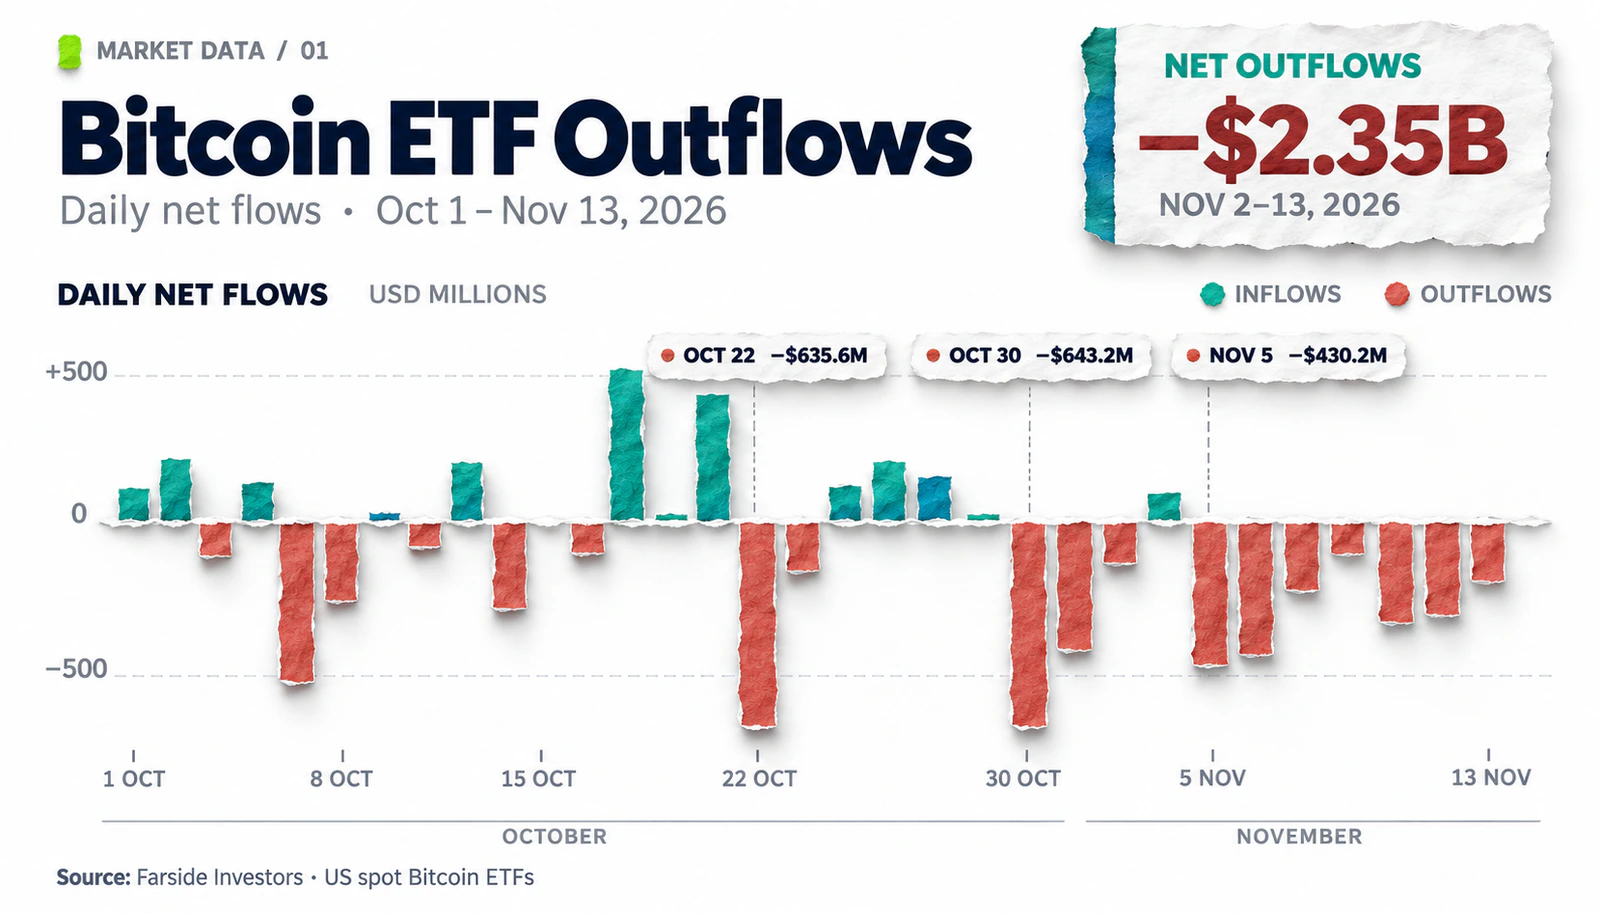
American spot Bitcoin exchange-traded funds ended the second consecutive week with a net outflow of more than $1 billion. According to Farside Investors statistics, from November 2–13, 2026, the cumulative negative flow amounted to $2.347 billion. During this period, only one out of ten trading sessions ended with a net capital inflow—on November 4, when it reached $74.6 million.
By November 13, the series of negative sessions continued for seven trading days. On November 13, American spot Bitcoin ETFs recorded a net outflow of $185.4 million, with $143.5 million attributed to BlackRock's iShares Bitcoin Trust (IBIT) and $41.9 million to the Fidelity Wise Origin Bitcoin Fund (FBTC).
However, the reduction in capital was unevenly distributed among the funds.
Period | All Bitcoin ETFs | IBIT | FBTC |
|---|---|---|---|
November 2–6 | −$1,281.7 million | −$1,209.5 million | +$93.1 million |
November 9–13 | −$1,065.3 million | −$908.4 million | −$111.3 million |
Total | −$2,347 million | −$2,117.9 million | −$18.2 million |
Source: Farside Investors. Calculations by UNUM based on daily flows from November 2–13, 2026.
From November 2–13, the net outflow from IBIT was $2.12 billion, or about 90.2% of the cumulative negative result of American Bitcoin ETFs. Meanwhile, FBTC, which was attracting capital at the beginning of November, also switched to negative flows in the second week.
These differences indicate that investor activity in individual funds is not uniform. The significant concentration of redemptions in IBIT does not mean that holders of all Bitcoin ETFs are simultaneously and equally reducing their positions.
The change in flows coincided with a significant decline in the cryptocurrency's value. On November 2, Bitcoin closed the day around $76,709, and by November 14, it was around $64,120. According to CoinGecko, on November 15, Bitcoin closed the day around $65,305 UTC, remaining 14.9% below the closing level of November 2.
However, there is a significant difference here: Bitcoin trades 24/7, while American ETFs conduct exchange operations on business days. Therefore, it cannot be assumed that the outflows recorded on November 13 directly explain all subsequent BTC fluctuations over the weekend.
Why investors are reducing investments in Bitcoin ETFs
The reasons for Bitcoin's decline and capital outflows from ETFs may be linked to several factors simultaneously influencing investors' decisions. These include U.S. monetary policy, reduced interest in risky assets, loss realization, and changes in investment portfolio structures.
Meanwhile, public fund statistics show the volume of net flows but do not reveal the motives of each investor. Therefore, the reasons must be assessed based on a combination of market indicators.
Fed policy and the cost of capital
The Federal Reserve's monetary policy remains one of the macroeconomic factors capable of influencing Bitcoin's value and demand for exchange-traded funds. High interest rates increase the attractiveness of income-generating instruments with relatively low risk and raise the cost of borrowed capital.
At the meeting on October 28, 2026, the Federal Reserve maintained the target range for the federal funds rate at 3.75–4.00%. In the official statement, the regulator noted the persistence of elevated inflation and the need for additional data to determine future policy. Two committee members advocated for a 0.25 percentage point rate increase.
For Bitcoin, not only the current rate matters but also expectations regarding its future changes. If market participants start to anticipate a prolonged period of tight monetary policy, it may limit investors' willingness to increase positions in highly volatile assets.
An additional reference point is the yield on U.S. government bonds. An increase in real yield raises the alternative cost of holding Bitcoin, which does not generate interest income itself. However, this relationship is not constant and does not allow for a direct calculation of how much capital should exit Bitcoin ETFs with a certain rate change.
The relationship between inflation, the dollar, and interest rates is examined in more detail in the UNUM analysis on Fed policy. Upcoming economic statistics can be tracked through the UNUM economic calendar.
Decline in Interest in Risky Assets
Another possible explanation for the outflows is the deterioration of sentiment in financial markets. Bitcoin often reacts to the same changes in liquidity and risk appetite as technology stocks.
In early November, the decline in BTC was accompanied by a sell-off in American tech stocks. However, the subsequent market dynamics were uneven. In the November 11 research, Glassnode analysts noted that the S&P 500 and Nasdaq 100 recovered after the previous decline, whereas Bitcoin continued to lag.
This is an important factor: general macroeconomic conditions may have been the initial source of pressure, but the subsequent weakness of BTC indicated demand issues within the cryptocurrency market itself.
Bitwise analysts in the Crypto Market Compass review from November 9 described the situation as follows:
Sentiments in both cryptocurrency and traditional financial markets remain weak.
However, Bitcoin's dependence on the stock market should not be considered absolute. The BTC price is additionally influenced by its own liquidity sources, operations of large holders, and activity in the derivatives market.
This relationship was previously examined in detail by UNUM in the article “How the Nasdaq Decline Changes Bitcoin's Prospects”.
Loss Realization and Portfolio Reassessment
A prolonged Bitcoin correction can change investor behavior, even if their long-term attitude towards cryptocurrency remains positive.
There are several motives for reducing positions:
Limiting losses. Investors who purchased ETF shares at higher prices may close positions amid further BTC price declines.
Portfolio rebalancing. Managers may reduce the cryptocurrency share to return asset allocation to established risk limits.
Reducing overall volatility. Investors may decrease positions in several high-risk instruments simultaneously.
Closing arbitrage strategies. Some participants use ETFs in conjunction with futures, so changes in the yield of such operations can affect investment volumes.
On-chain data confirms that pressure on Bitcoin holders has intensified. In the November 11 report by Glassnode, the average acquisition cost of BTC by short-term holders was estimated at approximately $75,600. This indicator used data up to November 9. By this time, a significant portion of coins purchased in the last 155 days was already in the unrealized loss zone.
However, it cannot be asserted that these holders were the primary sellers of Bitcoin ETFs. On-chain statistics and data on shareowners pertain to different categories of participants and do not allow for direct identification of their identities.
Are Institutional Investors Really Leaving Bitcoin?
Despite significant outflows in November, the long-term statistics of American Bitcoin ETFs do not yet confirm that institutional demand for Bitcoin is disappearing.
According to Farside Investors, since the start of trading spot funds in January 2024, their cumulative net capital inflow by November 13, 2026, amounted to approximately $54.7 billion. Only IBIT attracted approximately $64.2 billion in net funds during this period, compensating for negative flows from other products.
The scale of accumulated investments shows how significant the Bitcoin ETF market has become. However, historical investments in Bitcoin through exchange-traded funds do not guarantee capital preservation: ETF inflows and outflows depend on market participants' decisions and can quickly change direction. This also does not prove that all investors adhere to a long-term strategy.
Why Capital Outflow Does Not Equal Fund Asset Reduction
To assess the sustainability of demand, it is necessary to distinguish between two indicators:
Net Flow — the net volume of fund share creation and redemption over a certain period.
Assets Under Management (AUM) — the value of the fund's assets, which depends on both the number of BTC held and their market price.
For example, according to official BlackRock data, as of November 13, the assets of IBIT amounted to about $54.13 billion. Changes in this amount in subsequent days can occur even without additional redemptions if the value of Bitcoin decreases.
Therefore, a decrease in AUM cannot automatically be considered equivalent to capital withdrawal by investors. For a more accurate assessment, it is necessary to compare cash flows, the number of shares in circulation, and the volume of BTC on the fund's balance sheet.
What Is Known About Institutional ETF Holders
Additional information about large investors is contained in Form 13F reports, which investment portfolio managers submit to the U.S. Securities and Exchange Commission (SEC).
Such documents disclose positions on certain securities, including reportable exchange-traded funds. However, the statistics have a significant limitation: the reports are submitted quarterly, not daily.
The deadline for submitting standard reports for the third quarter of 2026 is November 16. Therefore, even new documents show positions as of September 30 and do not allow for determining which institutional investors sold Bitcoin ETFs directly at the beginning of November.
Moreover, ETFs are available not only to banks and investment funds but also to private investors. Data on aggregate redemptions do not show who exactly owned the sold shares.
Thus, the current outflows confirm a reduction in demand through regulated exchange-traded products but do not prove a mass exit of institutional investors from Bitcoin as a separate asset class.
How ETF Outflows Affect Bitcoin Price
Spot Bitcoin ETFs allow investors to access cryptocurrency through an exchange-traded instrument without self-custody of BTC. Shares of such funds are traded on the stock market, and their value is linked to the price of the underlying asset.
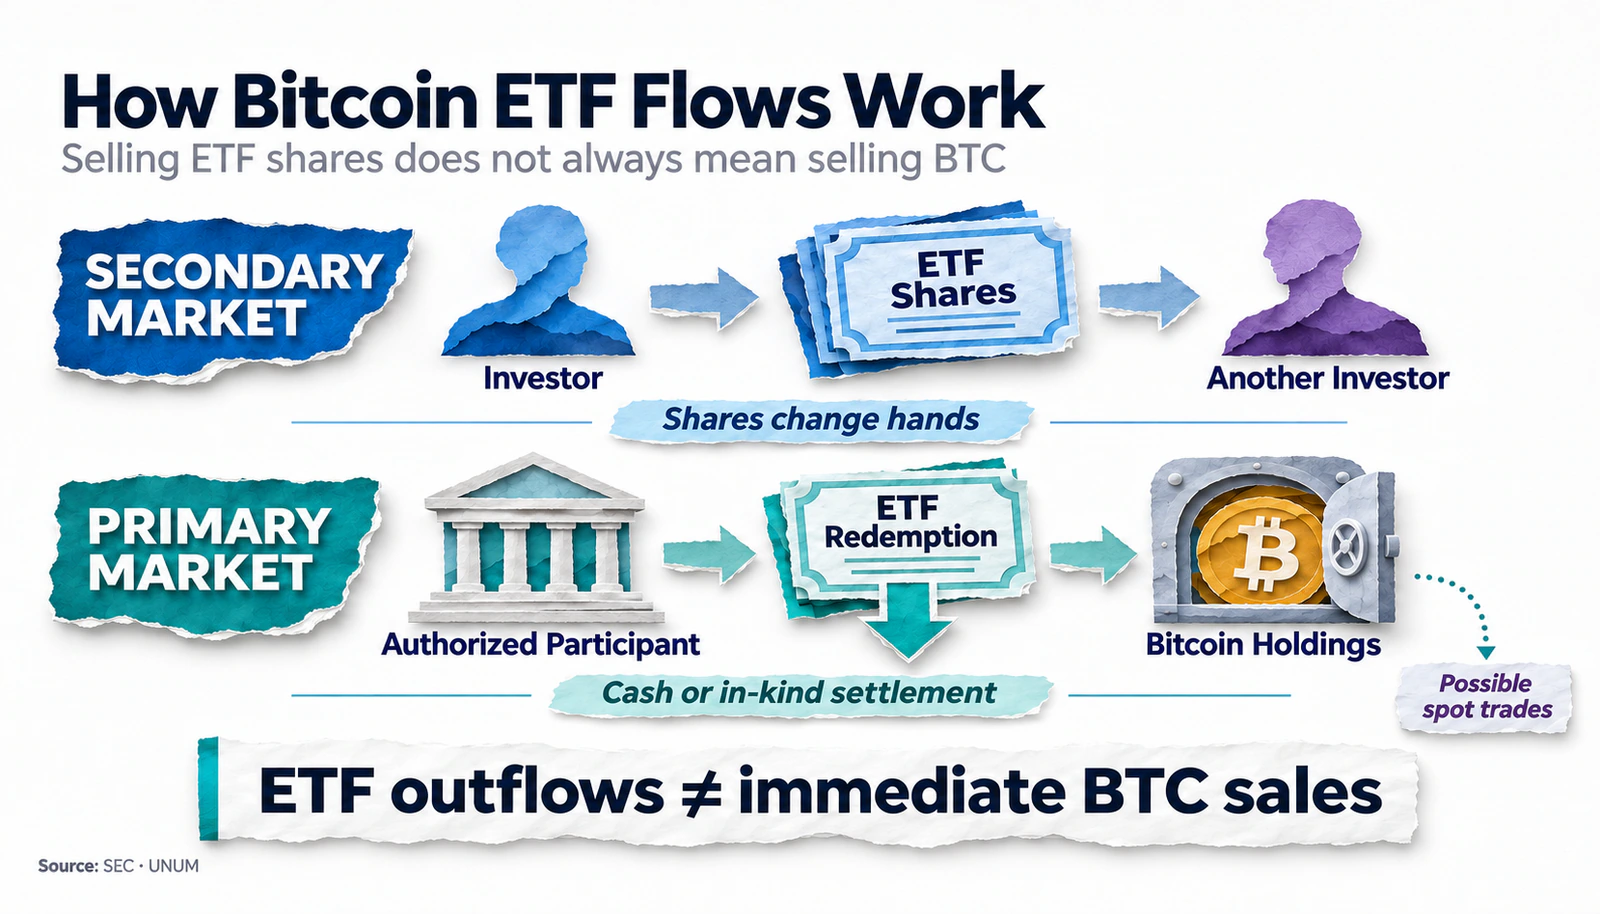
However, selling ETF shares and selling Bitcoin on a cryptocurrency exchange are not the same.
When an investor sells shares on the secondary market, another market participant may purchase them. Such transactions do not necessarily require the redemption of shares and the realization of BTC owned by the fund.
The change in the number of shares occurs through a creation and redemption mechanism involving special financial intermediaries — authorized participants. They help reduce the discrepancy between the market price of shares and the value of the fund's underlying assets.
In July 2025, the SEC allowed the creation and redemption of cryptocurrency ETP shares in-kind. This means the possibility of transferring the underlying crypto asset in such operations alongside cash settlements. However, the actual use of such a mechanism depends on the specific fund's documents and the capabilities of the participating financial intermediaries.
Depending on the mechanism used and the actions of intermediaries, redemptions may be accompanied by BTC sales on the spot market. But the volume of net ETF outflows cannot be directly equated to the volume of immediate market sales of Bitcoin.
Why Pressure May Spread to Other Market Segments
The influence of ETFs on Bitcoin is not limited to direct operations with the underlying asset: even without selling a comparable amount of BTC, outflows can alter market participants' expectations.
Sustained reduction in investments is perceived as a signal of weak demand from investors using traditional financial infrastructure. This may change the behavior of spot buyers, derivatives traders, and large holders.
With a high proportion of leveraged positions, an initial price decline can be exacerbated by forced liquidations. When collateral value becomes insufficient, trading platforms close positions, increasing short-term price pressure.
Thus, ETFs can serve as one of the channels for transmitting market stress, but to assess their actual impact, it is necessary to compare capital flows with spot trading volumes, open interest, and liquidations.
What Derivatives and On-Chain Data Show
Bitcoin's behavior in November was determined not only by ETF operations. Additional market insights are provided by open interest in futures, funding rates, and blockchain data.
In the Bitfinex Alpha review from November 11, it was noted that the total open interest in Bitcoin futures reached approximately 701,900 BTC. This was 3.3% higher than the figure on November 8, although during the same period, the cryptocurrency's price fell by 2.6%.
Such a discrepancy indicates that the volume of open BTC positions could increase even in a declining market. However, open interest alone does not show which participants were on the prevailing side, as each open long contract corresponds to a short one.
For a more comprehensive assessment, it is necessary to consider the funding rate — periodic payments between participants in perpetual futures. A positive funding rate usually means that long position holders pay short holders. When negative, the direction of payments reverses.
BTC volatility can be exacerbated by mass liquidations of futures positions, especially when there are insufficient buyers in the spot market.
If open interest grows amid weak spot demand, the market may become more sensitive to sharp price changes. At the same time, a decrease in the dollar value of open interest does not always mean a reduction in the number of contracts: part of the change arises directly from the BTC price drop.
Other Sources of Liquidity Are Also Shrinking
Changes in cryptocurrency market liquidity have also manifested in the reduction of stablecoin supply, although this indicator does not directly measure BTC demand.
In a review from November 11, Glassnode reported a reduction in the total stablecoin supply by approximately $14.2 billion over the previous 30 days. This figure used data as of November 9. Simultaneously, Glassnode noted that the 30-day average Coinbase premium remained negative, indicating relatively weak BTC demand in the US market.
A negative premium may indicate relatively weak demand from US market participants. However, it does not allow for a clear determination of the composition of buyers and sellers.
The reduction in stablecoin supply should not automatically be considered a sale of cryptocurrencies for an equivalent amount. It characterizes the change in the volume of circulating tokens pegged to fiat currencies and requires separate analysis of issuance and redemption reasons.
The impact of this process on market liquidity is examined in more detail in the UNUM article "The Stablecoin Market Shrunk by $14.2 Billion. What Does This Mean for Cryptocurrencies".
The coincidence of negative ETF flows, weak US spot demand, and a reduction in stablecoin supply strengthens the arguments for a general deterioration in liquidity conditions. However, the quantitative contribution of each factor to the BTC decline remains uncertain.
What Happened After Previous Bitcoin ETF Outflows
The history of US spot Bitcoin ETFs shows that negative flows do not necessarily lead to a prolonged cryptocurrency decline. However, price recovery does not always begin simultaneously with the return of capital to the funds.
In a Glassnode study from November 11, it was noted that in previous episodes of sustained outflows, inflows returned only after a local BTC minimum was formed.
In each case, inflows resumed only after Bitcoin reached its minimum, so the return of inflows could confirm the formation of a bottom only after this event.
This observation is important for interpreting current data. If the return of positive flows occurs with a delay, it may serve as confirmation of stabilization but does not necessarily allow for the early identification of the end of the decline.
In turn, Bitfinex Alpha analysts in a study from November 11 formulated a more cautious approach: "The slowdown of outflows is the first step towards forming a price bottom, but it is not a signal in itself."
In the November 11 study, Bitfinex Alpha referred to its own analysis from November 4. According to this assessment, after negative ETF series followed by at least three consecutive sessions of net inflow, the median BTC growth over the next ten trading sessions was 6.4%. The analysis covered individual episodes in 2026 and is not a universal pattern.
This assessment should not be taken as a forecast of the current recovery. It is based on selected historical episodes, and its applicability depends on liquidity conditions, leverage, and macroeconomic factors.
Therefore, a significant signal may not be a single positive day, but a sustained change in flows against the backdrop of improving other market indicators.
What will happen to Bitcoin if ETF outflows continue
The Bitcoin forecast for the coming weeks primarily depends on the recovery of demand, liquidity conditions, and whether investors will continue to reduce positions in ETFs.
Based on current data, three scenarios can be identified.
1. Recovery of institutional demand
Bitcoin ETF outflows gradually cease, after which funds transition to a sustainable positive result. Simultaneously, spot demand indicators improve, and the derivatives market does not show excessive leverage buildup.
Such a combination could indicate a more solid foundation for BTC recovery. However, even several positive sessions do not rule out new sales if external conditions deteriorate.
2. Prolonged consolidation
Negative flows decrease, but there is no full influx of new money. In such a situation, Bitcoin may continue to fluctuate within a wide range, reacting to macroeconomic statistics and liquidity changes.
This scenario is characterized by the absence of sustainable demand capable of supporting a prolonged price movement. Individual short-term BTC increases may occur due to short position closures, not accompanied by a comparable rise in spot purchases.
3. Increased market pressure
Prolonged ETF outflows are combined with weak spot demand, increased realized losses, and additional liquidations of leveraged positions.
In such a situation, sales by different participant categories may mutually reinforce each other. However, the depth of a possible decline will depend on the actual market liquidity and buyer behavior, not just ETF redemption statistics.
Which indicators will help determine market direction
To assess the further situation, it is necessary to monitor several indicators simultaneously:
Bitcoin ETF flows. The sequence of positive or negative trading sessions is important, not just the result of one day.
Amount of BTC in funds. Allows assessing the change in the volume of the underlying asset separately from fluctuations in its dollar value.
Spot demand and Coinbase Premium. Help determine if buying activity is returning to the market.
Open interest and funding rate. Show changes in futures market activity and the cost of holding leveraged positions.
Bond yields and Fed rate expectations. Reflect external financial conditions that can influence investor risk appetite.
The current price dynamics, trading volumes, and key on-chain indicators can be tracked on the Bitcoin (BTC) page in UNUM.
What Bitcoin ETF outflows mean for the cryptocurrency market
The outflow of $2.35 billion in the first two trading weeks of November confirms a significant weakening of demand for Bitcoin through U.S. spot ETFs. About 90% of the negative result was attributed to IBIT, showing a high concentration of capital reduction in the largest fund.
Available data indicates a combination of several factors: tight monetary conditions, deteriorating risk sentiment, weak spot demand, and ongoing activity in the derivatives market. However, it is currently impossible to determine the exact contribution of each to the decline in BTC price.
The accumulated inflow of $54.7 billion since January 2024 shows that Bitcoin ETFs continue to occupy a significant place in the digital asset market. November redemptions themselves do not prove institutional investors' rejection of Bitcoin but confirm a reduction in net capital inflow through one of the largest regulated investment channels.
The main condition for a sustainable recovery will not just be the cessation of outflows, but the return of demand, confirmed by ETF dynamics, spot volumes, and liquidity conditions.