Article prepared with the support of partner UNUM — broker Axi.
How Gold Lost a Significant Portion of Its Value in 2026
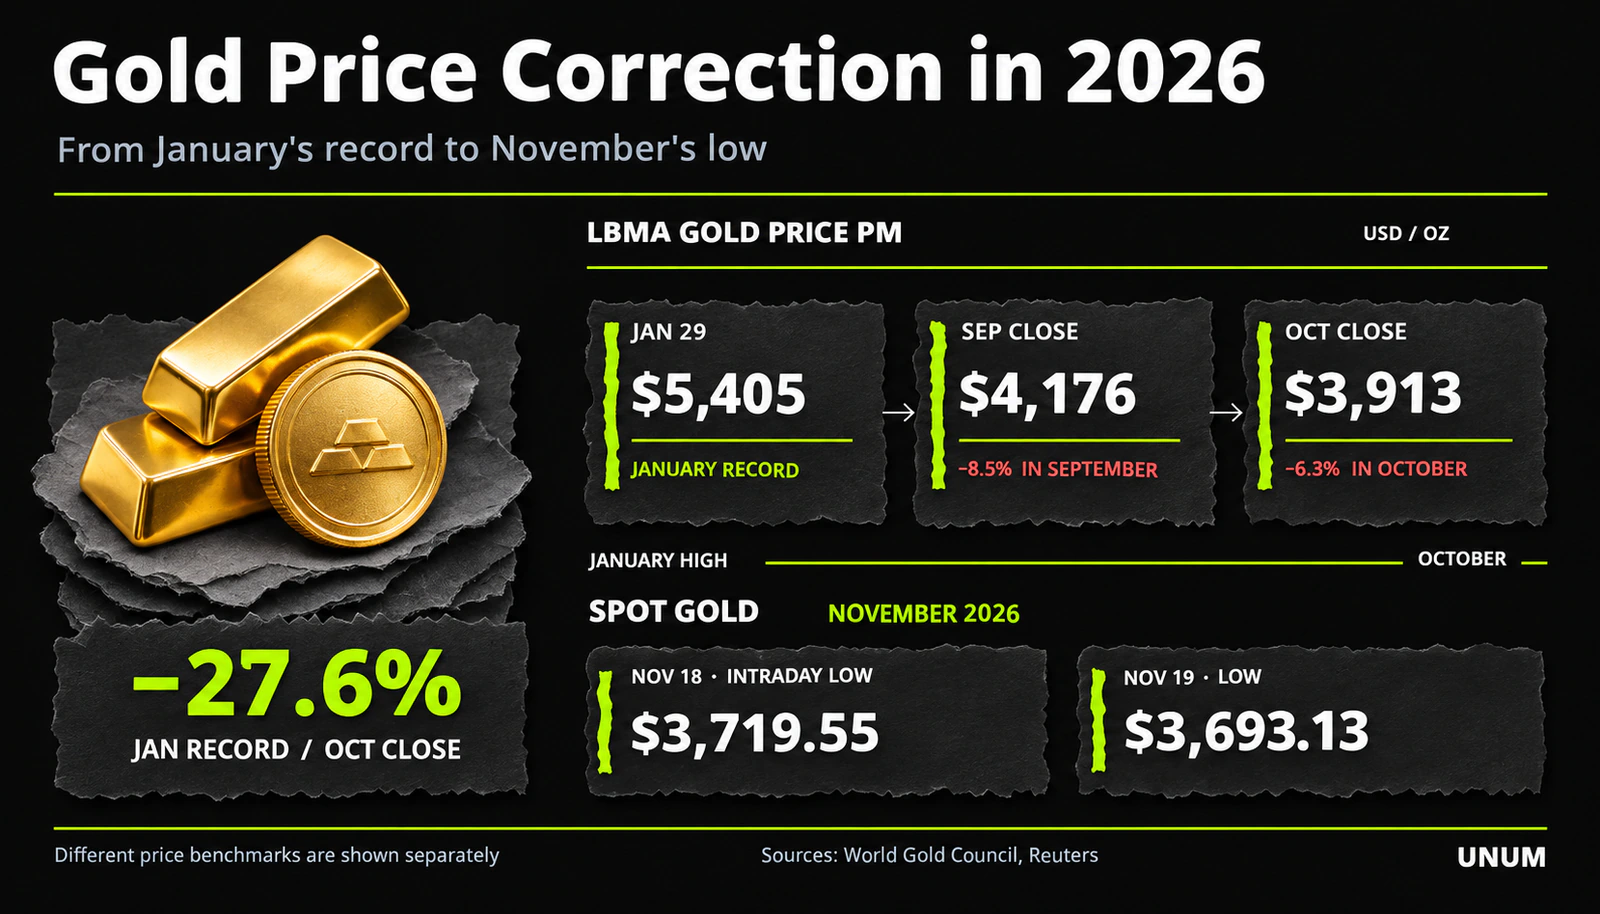
At the beginning of 2026, gold was at the center of attention for global investors. According to the World Gold Council (WGC), on January 29, the metal's price according to the London benchmark LBMA Gold Price PM reached a record $5,405 per troy ounce. However, the subsequent months demonstrated how quickly conditions can change even for an asset traditionally viewed as a store of value.
A noticeable acceleration of the correction occurred in the fall. In September, gold fell by 8.5%, ending the month at $4,176 per ounce. The decline continued in October: the metal lost another 6.3%, with its price reaching $3,913 by the end of the month. Thus, by the end of October, gold was approximately 27.6% lower than the January record. The calculation is based on comparable LBMA Gold Price PM values.
November also did not bring a sustainable recovery. According to Reuters, on November 18, spot gold fell by approximately 3.2% to $3,726.19 per ounce as of 2:30 PM Eastern Time in the US. During trading, the price dropped to $3,719.55, reaching its lowest point since September 2025. December gold futures in the US ended the session down 3.2% at $3,741.90.
On November 19, gold continued to decline. At the start of trading, spot quotes fell to $3,693.13, later reaching $3,667.19 per ounce. However, the sell-off did not end there. On the morning of November 20, the price of gold dropped to $3,525.25 per ounce as of 05:04 UTC, losing 2.7%. December futures in the US fell by 4.3% to $3,526. According to Reuters, the decline in gold since the beginning of the week reached approximately 9.2%, marking the most significant drop since March 2026.
When comparing these figures, it is important to consider the differences between the London benchmark, spot quotes, and futures prices. To calculate returns over an extended period, one comparable price series should be used.
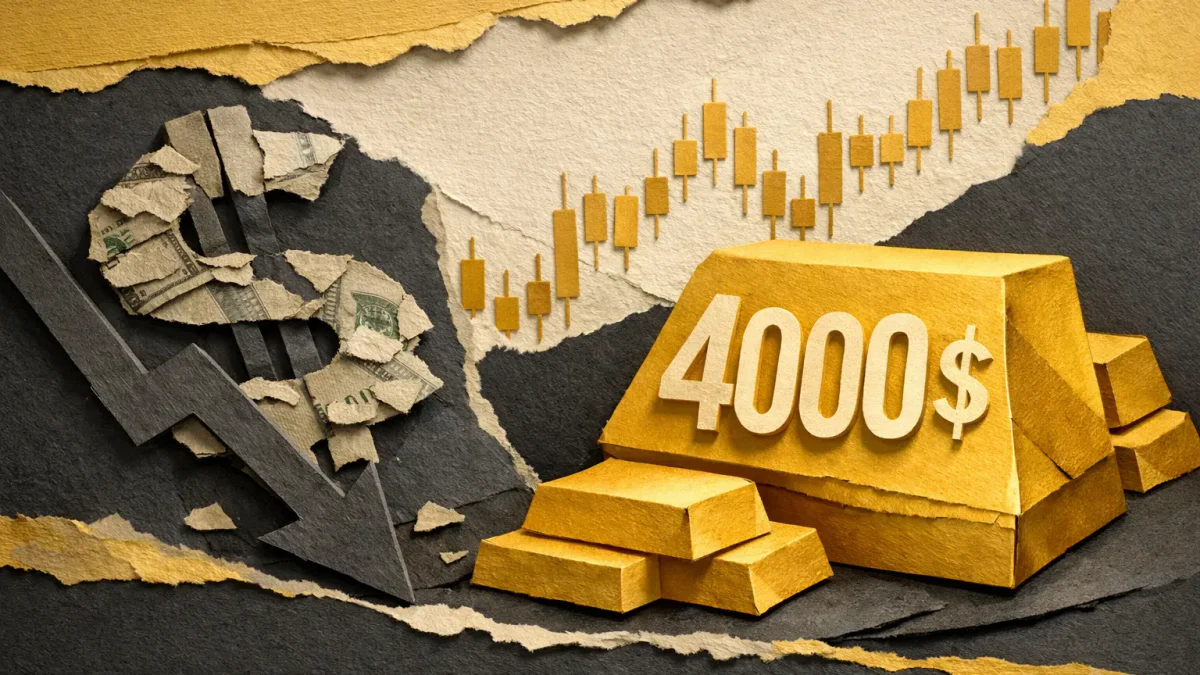
The decline was uneven. Between periods of sell-offs, there were attempts at recovery. For example, on November 4, gold temporarily returned above $4,000 per ounce, but the subsequent decline showed that this was not enough to change the overall market direction.
Research by the World Gold Council, published on November 5, highlights three likely reasons for the October correction: revised expectations for Fed rates, a reduction in speculative positions, and a temporary shift by investors from gold and stocks to bonds.
These processes can amplify each other. Rising yields make bonds more attractive, increased demand for the dollar creates additional pressure on gold prices, and a reduction in positions in the futures market can accelerate the price decline. Meanwhile, fundamental demand for physical metal does not necessarily decrease at the same rate.
Events from November 18–20 showed that pressure on gold is increasing not only due to expectations of rate hikes but also due to forced position closures. Senior market analyst at Capital.com Kyle Rodda, in a comment to Reuters on November 20, linked the sell-off to a reduction in positions in financial markets, concerns about persistent inflation, high bond yields, and a strengthening dollar. The combination of these factors can accelerate the decline in prices even with sustained long-term demand for the metal.
Why Fed Policy Has Become the Main Source of Pressure on Gold
One of the key factors in the current correction is the change in expectations regarding the monetary policy of the Federal Reserve System of the United States. The market has once again begun to consider the possibility of further interest rate hikes, which has affected the dollar, bonds, and the value of non-interest-bearing assets.
At the meeting on October 27–28, the Federal Open Market Committee (FOMC) maintained the target range for the federal funds rate at 3.75–4.00%. The decision was supported by ten voting members, while Lisa Cook and Beth Hammack advocated for an immediate rate hike of 25 basis points. These details are contained in the official Fed statement.
Disagreements within the regulator showed that some Fed representatives believe the existing financial conditions are not stringent enough for a sustainable return of inflation to the target level of 2%.
What the Published Fed Meeting Minutes Revealed
On November 18, the Federal Reserve published the minutes of the October meeting, which confirmed the readiness of most participants for further tightening of monetary policy.
According to the document, almost all participants in the discussion believed that under their baseline forecasts for inflation and the labor market, further rate hikes would likely be needed to bring inflation back to the target 2%.
Meanwhile, two Fed representatives suggested that at the next meeting, it might be necessary to raise the rate by more than 25 basis points if incoming inflation data prove unfavorable. Other participants warned that inflationary pressures might persist longer than expected, requiring a more stringent monetary policy.
Thus, the October decision to maintain the rate did not signify the end of the tightening cycle. On the contrary, the published materials showed that some committee members preferred to wait for additional statistics, remaining ready for further hikes.
An additional signal came on November 17 from St. Louis Federal Reserve Bank President Alberto Musalem. During a speech at the Central Bank of Argentina conference, he stated:
I believe that further departure from accommodative monetary policy will soon be necessary.
Musalem also suggested that several rate hikes might be needed for the U.S. economy to return inflation to the target level by spring 2027. This reflects the position of a specific Fed representative, not an approved decision of the entire committee.
How market expectations have changed
The publication of the minutes heightened investors' focus on the potential scale of the December rate hike.
According to Reuters, citing CME FedWatch, on the morning of November 20, the probability of a 25 basis point Fed rate hike in December was 96.8%. The probability of a more significant 50 basis point hike was estimated at 3.2%.
For comparison, on November 19, the probability of a 50 basis point hike had reached 10%. The subsequent reduction in this estimate shows that market participants have become more confident in the baseline scenario of a 25 basis point rate hike, although they have almost stopped considering the possibility of maintaining the rate at its current level.
These estimates are based on federal funds rate futures prices and can change during the trading session. They reflect market participants' expectations, not the regulator's final decision.
For gold, such a situation is unfavorable. The metal does not yield interest income, so higher rates increase the opportunity cost of holding it. Investors can earn income from interest-bearing instruments without relying solely on the asset's market value appreciation.
Moreover, gold reacts not only to actual Fed decisions. If market participants begin to expect a higher rate even before the meeting, it can preemptively alter bond prices, exchange rates, and investment flows.
In a previous analysis of U.S. inflation and Fed rate expectations, UNUM already examined how new macroeconomic data affect the U.S. currency and various asset classes. For gold, this mechanism is particularly important, as its value is closely linked to the dollar and government bond yields.
How a strong dollar and bond yields affect gold prices
Gold is predominantly quoted in U.S. dollars, so changes in the value of the American currency directly affect its affordability for international buyers. When the dollar strengthens against the euro, yen, and other currencies, purchasing the same troy ounce becomes more expensive for market participants using these monetary units.
In November, the dollar received additional support from expectations of further Fed rate hikes. According to Reuters, on November 20, the American currency remained near a 19-month high. The strengthening dollar continued to pressure gold, whose price fell below $3,550 per ounce by Friday morning.
The dollar index DXY, which reflects the dynamics of the American currency relative to a basket of six major currencies, is used to assess this dependency. However, the inverse relationship between the dollar and gold is not constant: in certain periods, both assets can appreciate simultaneously.
Equally important is the competition with U.S. government bonds. According to official data from the U.S. Treasury, on November 17, the yield to maturity of ten-year Treasury bonds was 5.10%.
Real interest rates, i.e., rates adjusted for inflation, are of particular importance. The higher the real yield of reliable debt instruments, the greater the potential income forgone by an investor who chooses to hold gold.
At the same time, the impact of the bond market cannot be reduced to the movement of nominal yields alone. For example, after the release of the Fed's minutes on November 18, the yields on certain U.S. bonds slightly decreased, as a significant part of the expected tightening was already priced in by the market. However, the dollar continued to receive support, and gold remained under pressure.
Nevertheless, the dependency is not absolute. During financial turmoil, concerns about the sustainability of government debts, or a sharp increase in uncertainty, gold may be in demand even with high interest rates.
Therefore, the current price of gold and the prospects for XAU/USD need to be analyzed alongside the dynamics of the DXY, real bond yields, and the direction of investment flows.
These interconnections can be tracked on the UNUM gold page, where quotes, charts, and key factors affecting the metal's value are presented.
Why High Inflation Doesn't Help Gold Hold Its Position
Gold is traditionally considered a hedge against inflation because its supply is limited, and its value is not directly dependent on the purchasing power of a single national currency. However, this does not mean that the metal necessarily appreciates with every acceleration in consumer price growth.
For the market, the central bank's reaction is crucial. If inflation forces the Fed to maintain high rates or raise them, the potential advantages of gold as a protective instrument may temporarily give way to the attractiveness of interest-bearing assets.
According to the U.S. Bureau of Labor Statistics (BLS), in October 2026, the Consumer Price Index (CPI) increased by 0.4% compared to September. The core index, excluding food and energy, rose by 0.3%. These figures indicate ongoing monthly inflationary pressure. Most annual CPI figures for October 2026 are unavailable due to the lack of comparable data for October 2025.
The impact of inflation on gold can manifest in two opposing directions:
Support for demand. Concerns about currency devaluation may prompt investors to increase their share of physical assets, including gold.
Pressure on quotes. Expectations of a tighter Fed policy may strengthen the dollar and increase bond yields, reducing the metal's attractiveness.
In November, the second mechanism was particularly noticeable. Investors focused not only on the current inflation in the U.S. but also on the likelihood that the American regulator would have to maintain tight financial conditions longer than previously expected.
The published Fed minutes confirmed that the regulator continues to view persistent inflation as a serious risk. Meeting participants noted ongoing price pressures, including the impact of energy costs, supply constraints, and demand related to the development of artificial intelligence infrastructure.
This is why inflationary risks can simultaneously support long-term interest in gold and create obstacles for its short-term recovery.
Are Investors Really Abandoning Gold
The decline in quotes may create the impression that investors are massively withdrawing capital from gold. However, statistics show a more complex picture. While some participants are closing positions in the futures market, others continue to increase investments in exchange-traded funds and physical metal.
According to the World Gold Council, in the third quarter of 2026, gold ETFs increased their holdings by 211 tons. Positive dynamics continued in October, despite a noticeable drop in the metal's value.
According to the WGC report on gold ETF flows, in October, global funds backed by physical gold attracted $2.7 billion, and their total holdings increased by 19 tons to a record 4,275 tons.
At the same time, the value of assets under management in ETFs decreased by 6% to $542 billion. This discrepancy is explained by the decline in the market price of gold: the value of existing holdings decreased, although the funds continued to attract capital.
The regional structure of flows was also uneven. European funds provided the main part of the October inflow, Asian investors remained net buyers, while North American ETFs recorded an outflow of approximately $512 million.
A completely different situation developed in the futures market. According to the November study by the World Gold Council, in October, net positions of the managed money category on the COMEX exchange decreased by approximately $7 billion, equivalent to 53 tons of gold. Analysts associate part of the sell-off with a reduction in speculative exposure and a shift of capital into bonds.
However, the reduction in long positions does not mean that most market participants necessarily expect a further collapse. For example, the CFTC report as of November 10 showed 226,234 long and 36,127 short contracts in the non-commercial category for gold futures. The net long position remained positive at 190,107 contracts.
These are data from the Futures Only report. The non-commercial category is broader than managed money, so the figures presented cannot be directly compared with the WGC's October estimate.
Differences are also noticeable in the physical market. Demand for gold bars and coins in the third quarter decreased by 19% year-on-year, to 268 tons. The jewelry sector acquired 313 tons of metal, which is 17% less than the result for the same period in 2025. At the same time, central banks continued to actively replenish reserves.
Structure of gold demand in 2026
Market Segment | Period | Data |
|---|---|---|
Gold ETFs | October | Inflow of $2.7 billion, stock increase by 19 tons |
COMEX Futures, managed money | October | Reduction of net positions by $7 billion, or 53 tons |
Central Banks | Q3 | Purchases of 321 tons |
Bars and Coins | Q3 | Demand of 268 tons, a 19% year-on-year decrease |
Jewelry Industry | Q3 | Demand of 313 tons, a 17% year-on-year decrease |
Sources: World Gold Council, Gold Demand Trends Q3 2026, Gold ETF Flows October 2026, and Gold Market Commentary October 2026.
These figures cannot be combined into a single balance as they relate to different periods and reflect various categories of market activity. However, their comparison helps to understand the main contradiction: the decline in gold prices is accompanied not by a universal decrease in demand, but by a redistribution of capital between instruments and investor categories.
In the short term, operations with derivatives can have a particularly significant impact on quotes. Closing large positions, reducing leverage, and changing demand for liquidity can amplify price movements even when long-term holders continue to buy metal.
Why central banks continue to buy gold
The behavior of central banks is noticeably different from the decisions of short-term market participants. State reserves are formed over a long horizon, and gold is used to diversify assets, reduce currency risk concentration, and maintain the stability of the reserve structure.
In the third quarter of 2026, central banks purchased 321 tons of gold. According to the World Gold Council, from January to September, their total purchases reached 675 tons, which is 6% more than the result for the same period of the previous year.
One of the most notable buyers remains the People's Bank of China. According to the November WGC review, in October the regulator reported the acquisition of another 26 tons of gold — the maximum monthly volume since October 2023. After these operations, the country's official gold reserves reached 2,435 tons.
This strategy is explained not only by expectations of price growth. Unlike short-term investors, central banks view gold as a reserve asset that does not represent a debt obligation of a specific issuer. Its value can fluctuate significantly, but owning the metal itself does not imply the risk of default by a specific borrower.
At the same time, increasing the share of gold in international reserves does not always mean a comparable increase in physical stocks. If the price of the metal rises, its share in the total value of reserves can increase even without new purchases. The opposite situation is observed when prices fall.
The differences between physical accumulation and value revaluation of reserves are discussed in detail in UNUM's analysis "Gold vs. Dollar: Are Central Banks Really De-dollarizing?".
Central bank purchases provide long-term support for demand but do not guarantee an immediate price recovery. In short time frames, the influence of interest rates, the currency market, and derivative operations can be stronger.
Why gold depreciates even during periods of market uncertainty
The status of a safe-haven asset does not mean that gold always appreciates during crises. In periods of sharp volatility increases, investors may sell almost any liquid assets, including those initially acquired to reduce portfolio risks.
This happens when market participants urgently need cash. For example, losses on stocks or derivatives may force an investor to reduce other positions to meet margin requirements or restore the necessary liquidity reserve.
In a comment to Reuters on November 18, KCM Trade's chief market analyst Tim Waterer described this characteristic of gold's behavior as follows:
Gold is once again being viewed as a liquid asset.
The analyst explained that market participants reduce positions to free up capital amid increased volatility.
Such behavior does not contradict the long-term protective role of gold. The metal can maintain its value for portfolio diversification but simultaneously experience short-term pressure when demand for cash and income-yielding bonds sharply increases.
An additional factor is the change in the structure of investment portfolios. If the yield on government bonds becomes attractive enough, some capital may shift from gold to debt instruments even without a deterioration in the metal's long-term prospects.
This is precisely the process the World Gold Council considers among the likely causes of the October correction. Researchers note that in certain periods, gold and bond yields moved in the same direction, although usually there is an inverse relationship between them. This indicates the influence of additional factors, including risk reassessment and reduction of leveraged positions.
What forecasts do analysts give for gold
After gold fell below $3,550, the question of its future price movement becomes particularly significant. The scale of the November correction has increased uncertainty regarding the timing of recovery. However, analysts' forecasts differ primarily due to the chosen horizon: short-term dynamics and long-term prospects of the metal depend on different factors.
World Gold Council suggests approaching an interim bottom
In a study on November 5, World Gold Council analyst Johan Palmberg examined historical conditions under which gold recovered after a prolonged decline. Three indicators were used for analysis: deviation of the price from the 200-day moving average, sharp strengthening of the dollar, and reduction of speculative positions.
According to the study, two out of three conditions were already observed at the end of October. However, speculative positions remained relatively high, so the author did not consider the formation of a sustainable bottom confirmed.
Palmberg formulated the preliminary conclusion as follows:
Our simple framework suggests gold may be nearing an interim bottom.
Translation: “Our simple analytical model indicates that gold may be approaching an interim bottom.”
Johan Palmberg, analyst at World Gold Council. Source — Gold Market Commentary, November 5, 2026.
The historical check by WGC showed that with at least two conditions met, positive three-month returns were observed in 9 out of 10 cases considered. When all three conditions were met, gold appreciated over the next three months in all five historical episodes.
However, the sample size is small, and past results do not guarantee a repeat of the scenario. Moreover, the model relates to a three-month horizon and does not allow determining the exact reversal price.
The continued decline on November 20, when quotes fell to $3,525.25, showed that preliminary signs of approaching an interim bottom do not rule out further sell-offs. The WGC study was published on November 5, before the latest stage of the correction, so its conclusions cannot be considered as confirmation of forming a sustainable foundation for price recovery.
UBS maintains a positive medium-term forecast
A more optimistic assessment was presented by the investment division of UBS. In a material published on October 20, the bank confirmed a forecast for gold to rise to approximately $5,400 per ounce by September 2027.
As the main factors, UBS highlighted central bank purchases, reserve diversification, and concerns about the sustainability of government finances. At the same time, analysts acknowledged that high real yields and a strong dollar could support volatility in the short term.
In the November issue of UBS House View, the baseline target for June 2027 was $5,200 per ounce. However, the initial market data of the document related to October 21, so the forecast should not be presented as an assessment revised after the decline on November 18–19.
Thus, UBS's medium-term position is based on the expectation of a gradual easing of macroeconomic factors currently weighing on gold. If the Fed maintains a tight policy longer than anticipated, the timeline for recovery may shift.
What conditions will determine price movements until the end of 2026
In the short term, three main scenarios can be highlighted.
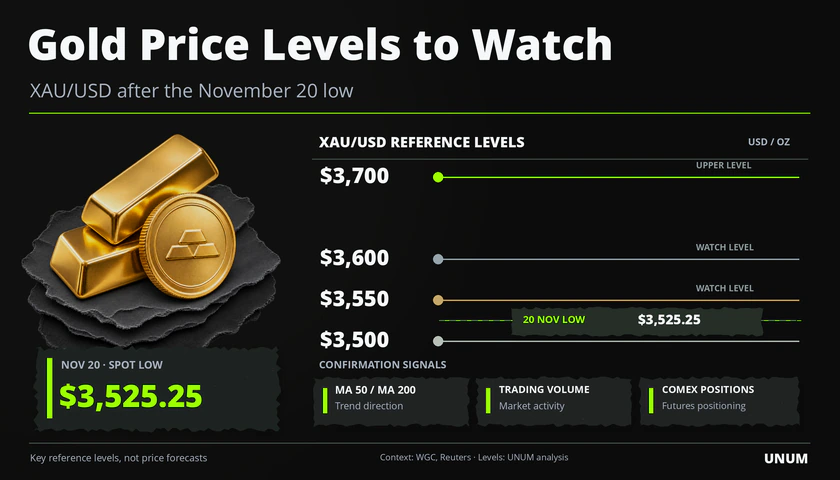
1. Continued decline. If the Fed confirms its readiness to raise rates, the dollar will continue to strengthen, and real bond yields will remain high, gold may face a new wave of selling. Additional pressure is possible with further reduction of futures positions. After falling below $3,550, market participants' attention shifts to the psychological mark of $3,500 and the ability of quotes to stabilize after a rapid decline in the metal's value.
2. Stabilization of quotes. If rate expectations stop changing significantly and demand from ETFs and central banks persists, gold may trade within a relatively narrow range. However, certain macroeconomic publications can cause sharp short-term fluctuations.
3. Recovery of value. Weakening of the dollar, reduction in real yields, and decreased expectations of further rate hikes may improve conditions for XAU/USD growth. Additional support will come from renewed interest from futures market participants.
These scenarios of gold recovery and further decline represent an analysis of possible conditions, not guaranteed price forecasts. Their realization primarily depends on the Fed's decisions, inflation data, and actual capital movements.
Key XAU/USD levels monitored by market participants
The fall of gold below $3,550 continued the breach of several previously significant technical levels. The consistent decline in quotes shows that sellers maintain an advantage, and market participants have yet to see convincing signs of a sustainable bottom formation.
In an October study by the World Gold Council, the area of $3,857 per ounce, corresponding to the 38.2% Fibonacci retracement level from the prolonged gold rally that began in 2015, was considered. Analysts allowed for a test of this level if the decline continued. By November 18, spot quotes had already fallen below this mark, reaching $3,693.13 on November 19.
Thus, previously significant levels of $3,857, $3,800, and $3,700 failed to halt the decline. After falling to $3,525, the nearest psychological target becomes $3,500 per ounce. In the event of a recovery attempt, attention may shift to the marks of $3,550 and $3,600, and then to the area of $3,667–3,700, which gold surpassed during the sell-off on November 19–20. These levels should be viewed as guidelines for observing price reactions rather than confirmed reversal boundaries.
In such conditions, the market's behavior after reaching a price is more significant than the price itself. If quotes quickly return above a previously breached level and hold there, it may indicate a weakening of seller pressure. Prolonged movement below previous lows, on the other hand, indicates continued weakness.
To assess the technical picture, it is necessary to compare:
the position of the price relative to the 50- and 200-day moving averages;
the dynamics of trading volumes and open interest;
changes in long and short positions on COMEX;
the reaction of XAU/USD to Fed releases and U.S. statistics;
the ability of the price to hold above or below recently formed ranges.
However, technical indicators cannot reliably predict the regulator's decision or sudden changes in investment flows. Therefore, they should be considered alongside fundamental factors.
Changes in XAU/USD quotes are of interest not only to long-term investors but also to participants in the derivatives market. For example, broker Axi provides access to gold trading via CFDs. Such contracts allow positions to be opened on the rise or fall of the metal's value without physical purchase. However, using CFDs, especially with leverage, carries the risk of significant losses. Trading conditions and instrument availability depend on the client's jurisdiction.
What risks arise when trading gold with leverage
One of the features of CFDs is the ability to use leverage. It allows controlling a position whose nominal value exceeds the amount of funds allocated as collateral. The financial result is calculated based on the full size of the position, not just the margin deposited.
Consider a hypothetical example. Suppose the price of gold is $3,800 per ounce, and a market participant opens a long position of one ounce with 1:10 leverage. In this case, the nominal value of the position is $3,800, and the initial margin is $380.
If the price of gold decreases by 2% to $3,724, the loss will be $76 excluding trading costs. This corresponds to 20% of the initial margin, even though the metal itself has only decreased by 2%.
When using higher leverage, the share of loss relative to the deposited collateral will be even greater. Additionally, during sharp market fluctuations, the broker may require additional margin or forcibly close the position.
Leverage is not the only factor to consider. The actual trading result is also influenced by:
Spread. The difference between buying and selling prices, forming part of the trading costs.
Commissions and position rollover. Additional expenses that may arise depending on the account type and the duration of the trade.
Slippage. Execution of a trade at a price different from the expected one, especially during periods of high volatility.
Price gaps. Sharp changes in quotes, causing a stop order to be executed worse than the set level.
Margin requirements. The need to maintain a sufficient amount of funds for an open position.
In Axi's official explanation of commodity CFD risks, the broker warns that using leverage can significantly increase losses, and sharp market movements can prevent closing a position at the desired price.
Thus, trading gold CFDs differs from long-term investing in physical metal. It requires consideration not only of the price direction but also of the position size, margin requirements, trading costs, and possible sharp changes in market conditions.
What events could change the direction of gold by the end of 2026
The publication of the minutes from the October FOMC meeting on November 18 became one of the key events for the gold market. The document confirmed that the regulator considers further interest rate hikes likely necessary, and some participants allow for more decisive actions.
The next important event will be the FOMC meeting on December 8–9. In addition to the interest rate decision, the regulator will present updated economic forecasts, which will help assess the anticipated trajectory of monetary policy in 2027.
Another significant event is the publication of the U.S. Consumer Price Index for November on December 10. Since the statistics will be released after the FOMC meeting, its results will primarily influence expectations of further regulator decisions.
In addition to calendar events, market participants need to monitor several indicators:
DXY Dollar Index. A sustained strengthening of the U.S. currency can maintain pressure on gold.
U.S. Treasury yields. Changes in nominal and real yields affect the attractiveness of the metal relative to interest-bearing instruments.
Flows into gold ETFs. Continued inflows will indicate sustained interest from some investors.
Positions on COMEX. Reduction or recovery of long positions will help assess the sentiments of futures market participants.
Central bank purchases. New data will show the resilience of long-term demand for physical gold.
Dates of economic publications and market events can be tracked through the UNUM economic calendar, and changes in the metal's price can be monitored on the gold quotes page.
What the decline in gold means for the market's future prospects
The November correction shows that the status of a safe-haven asset does not exempt gold from the influence of interest rates, currency exchange rates, and short-term investment flows. Expectations of further tightening by the FOMC, high U.S. bond yields, and a strong dollar created conditions where some market participants preferred to reduce positions.
The publication of the FOMC minutes on November 18 and the continued decline in gold to $3,525.25 on November 20 provided further confirmation of this dependency. The approximately 9.2% decrease in the metal's price since the beginning of the week demonstrates how strong the influence of interest expectations, dollar strengthening, and position reductions can be. As investors consider further rate hikes, gold's short-term prospects remain sensitive to new macroeconomic data and statements from FOMC representatives.
However, statistics do not confirm a universal abandonment of gold. Exchange-traded funds continued to attract capital, and central banks increased their physical reserves. This indicates differences between short-term trading activity and long-term investment demand.
The outlook for gold until the end of 2026 will largely depend on the decisions of the Federal Reserve, the dynamics of real yields, and the behavior of the dollar. If the pressure from these factors eases, the metal may find conditions for recovery. Otherwise, the market risks facing a continued correction even with the strategic interest in gold from major buyers remaining intact.