


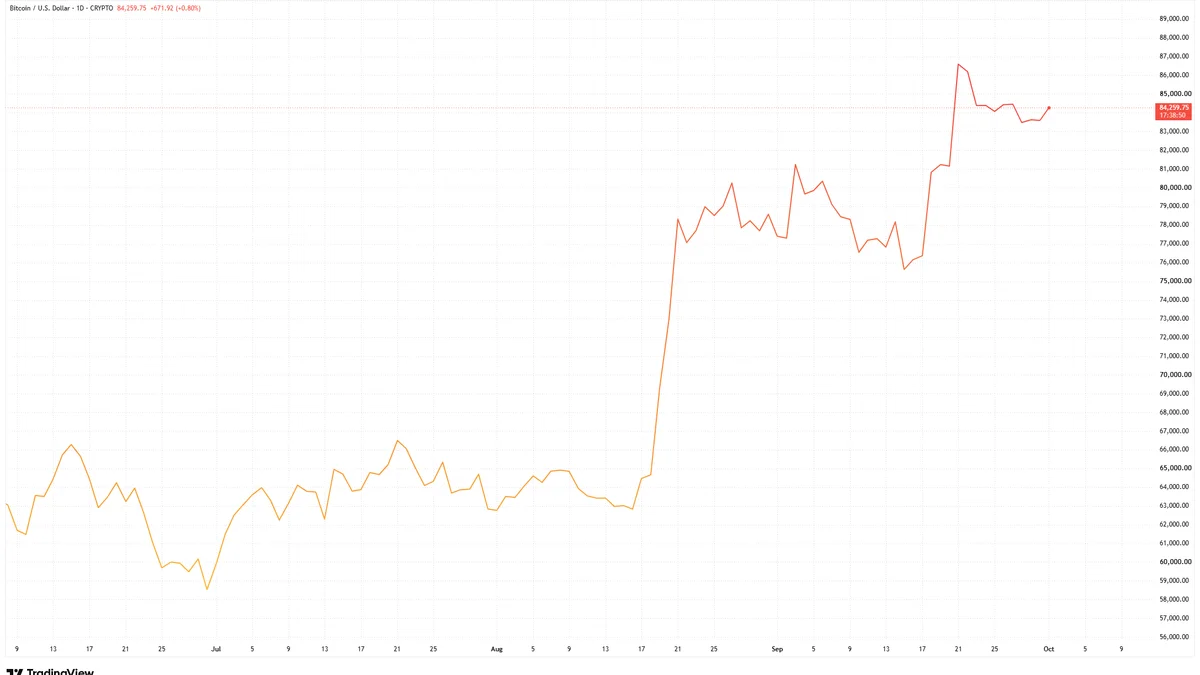
Bitcoin has recovered from summer lows around $58,000–$60,000 and on September 21 rose to approximately $87,300. After a pullback on October 1, it is trading around $83,500. In September, demand was supported by spot ETFs: in the week leading up to September 25, they attracted about $2.4 billion, and Strategy increased reserves to 847,666 BTC. By the end of the month, ETF inflows became more modest.
On September 16 the US Federal Reserve raised the rate for the first time in three years — to 3.75–4% — and left the possibility for further policy tightening. August inflation was lower than expected, so the likelihood of a rate hike in October decreased, but inflationary risks remain.
To assess the sustainability of the recovery, price dynamics alone are not enough. It is important to consider ETF flows, bond yields, inflation, and market reaction to new data. Based on these factors, we will consider three scenarios for the coming months: continued growth, range fluctuations, and decline.
Why It's Better to Consider Multiple Scenarios Instead of One Price
Bitcoin forecasts often boil down to a specific target: for example, $100,000 or $60,000. Such numbers attract attention but say almost nothing about why the market should reach this mark.
It is more practical to start with another question:
What conditions must be maintained for the price to continue growing, and what changes can reverse the movement?
This approach does not exclude forecasting but makes it verifiable. If inflation, central bank policy, demand through funds, or the behavior of large buyers change, the initial scenario can be revised.
Where Bitcoin Stands Now
As of October 1, Bitcoin is trading around $83,500. After rising to approximately $87,300 on September 21, the price retreated by about 4% and fell back below $85,000. Meanwhile, BTC is still significantly above the summer lows: around $58,000–$60,000 at the end of June and early July and approximately $63,000 in the first half of August.
The recovery from summer lows is ongoing, but the recent pullback does not yet allow for a confident statement about continued growth. To assess whether the market direction is changing, it is important to monitor demand data and whether the price can return above $85,000 and hold there.
What Can Support Further Growth
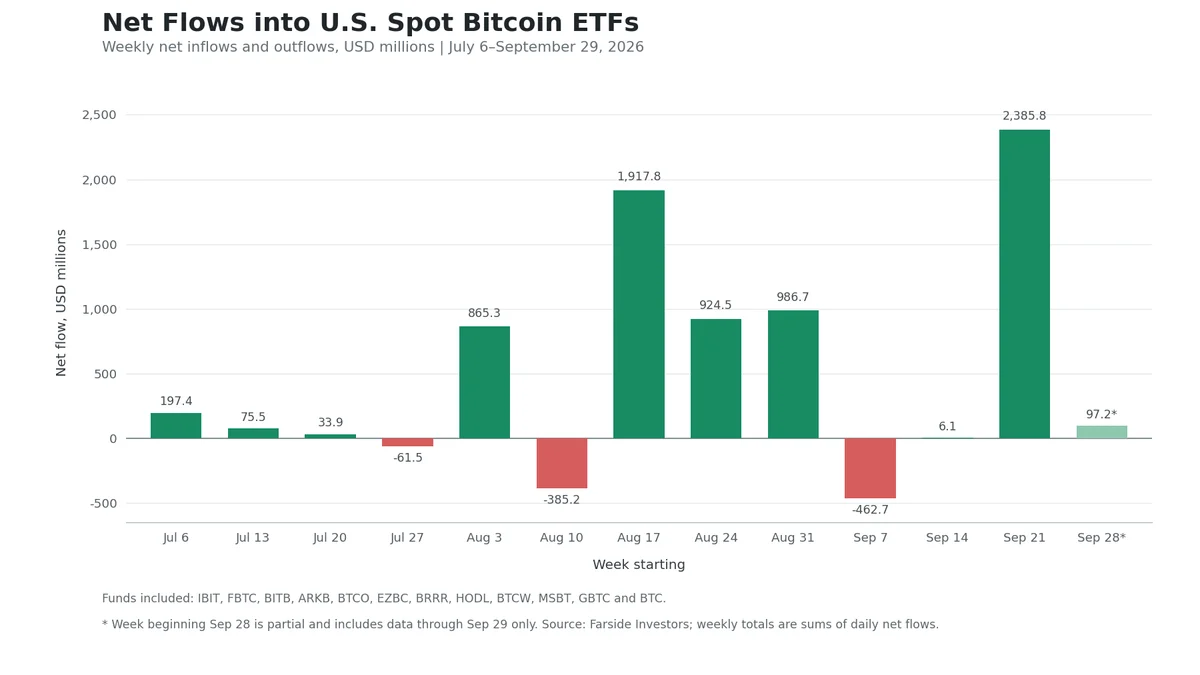
Demand through spot Bitcoin ETFs. American spot Bitcoin ETFs allow investors to gain exposure to BTC dynamics without holding the cryptocurrency directly. Flows into these funds help assess whether demand from investors is strengthening.
For the week ending September 18, the net inflow was only about $6 million: inflows of approximately $593 million on September 17 and 18 almost completely offset outflows at the beginning of the week. The following week, the situation changed: from September 21 to 25, funds attracted about $2.4 billion. The largest daily inflow was on September 21 — about $999 million.
After that, inflows continued but were more modest: about $31 million on September 28 and $66 million on September 29.
This dynamic indicates a significant increase in demand compared to the week before September 18. However, one strong weekly result is not enough to consider inflows sustainable. It is important to monitor whether they continue in the following weeks, whether different funds participate, and whether demand persists after the price pullback.
If net inflows persist, they can support demand for Bitcoin. If inflows weaken or turn into outflows, it will be a signal to reassess the sustainability of the recovery.
Company purchases. Additional demand for Bitcoin can be created by companies that hold it on their balance sheet. One of the largest public holders of BTC is Strategy, an American company formerly known as MicroStrategy. It develops business analytics software and simultaneously adheres to a Bitcoin accumulation strategy.
From September 21 to 27, Strategy acquired 1,665 BTC for approximately $142.7 million. The average purchase price was about $85,681. After this transaction, the company's reserves reached 847,666 BTC. The purchase was financed through the net proceeds from the sale of common stock MSTR. These data are indicated in Strategy's announcement and form 8-K filed with the SEC.
The purchase increases demand for BTC, but it should not be considered an independent growth signal. It reflects the decision of one company and does not itself show how broad the interest of other market participants is.
For assessing a positive scenario, a combination of factors is more important: new corporate purchases, sustained ETF inflows, and continued demand after a price increase.
Deeper involvement of financial companies. Institutional participation in the crypto market is gradually expanding. Coinbase analysts led by David Duong attribute the development of regulation and the integration of digital assets into the traditional financial system as key themes for 2026.
Grayscale also linked its positive market outlook to further development of institutional infrastructure. However, such assessments describe the long-term market direction and do not guarantee growth in a specific month.
What Can Halt Bitcoin's Growth
Fed rate hike. On September 16, the Federal Reserve raised the target range of the rate by 0.25 percentage points — to 3.75–4%. This was the first increase in about three years.
Most Fed participants also allowed for at least one more increase by the end of 2026. The reason remains persistent inflation.
A higher rate can hinder Bitcoin for several reasons:
The yield of relatively less risky instruments becomes more attractive.
Loans become more expensive, and available liquidity in the market decreases.
Investors are more cautious about assets with sharp price fluctuations.
The rise in US bond yields can support the dollar and create pressure on other assets.
However, the connection is not mechanical. After the September rate hike, Bitcoin initially traded around $76,000 and then rose above $85,000. This means that in the short term, demand, ETF inflows, and the closing of positions by traders betting on a decline outweighed the Fed's decision.
But this does not mean that the rate no longer matters. If inflation forces the Fed to raise it faster than the market expects, pressure on risky assets may increase.
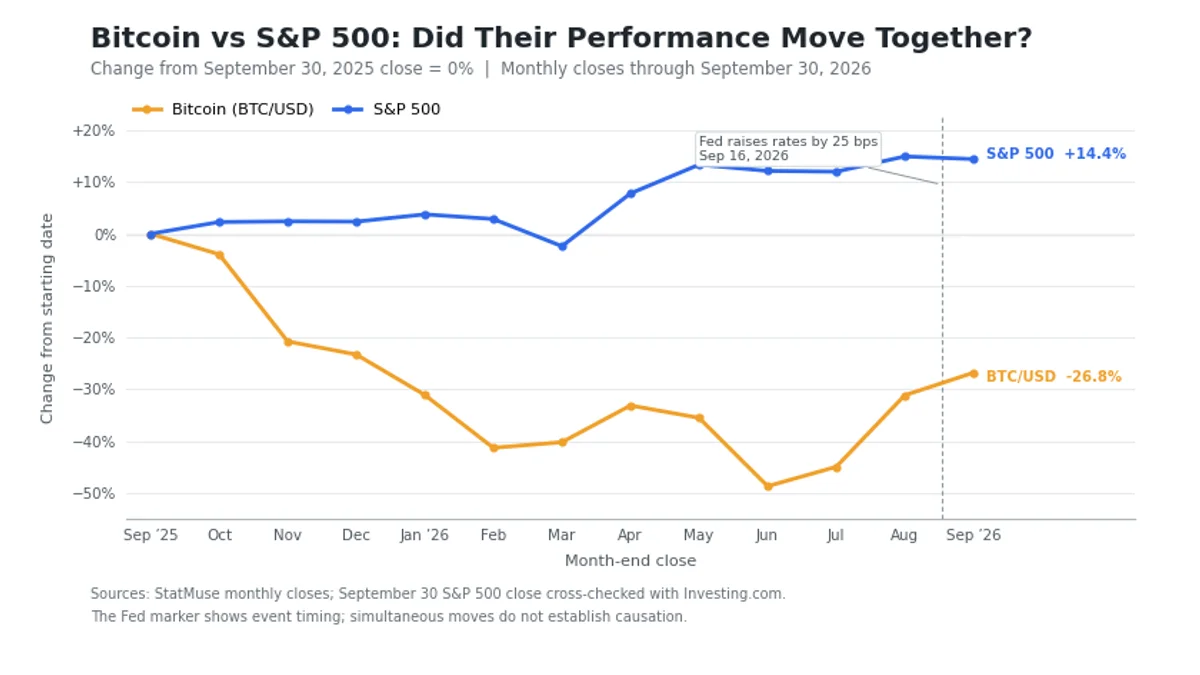
Such a chart will help understand whether the recent rise in Bitcoin is due to its own crypto market factors or is part of a general return of interest in risky assets. For example, on September 21, Bitcoin rose simultaneously with tech stocks and the Nasdaq index.
Unstable fund flows. ETFs can support the price, but money flows in both directions. After the rate hike, Bitcoin funds and Ethereum funds faced a combined daily outflow of nearly $592 million. Inflows resumed just a few days later.
Such a change in direction shows that part of the institutional demand remains sensitive to price and economic news. Therefore, it is more accurate to say not "ETFs push Bitcoin up," but "consistent net inflows can support the price as long as they persist."
Sales after rapid growth. The recent movement involved not only new buyers. Part of the growth was related to the closing of short positions. Within a day, crypto market participants betting on a decline faced liquidations of about $919 million. To close such positions, traders have to buy the asset, which can accelerate upward movement.
This creates an important distinction:
growth due to new long-term investments can be sustained longer;
growth due to the closing of short positions can quickly weaken after the liquidations are completed.
Therefore, after a sharp movement, it is useful to check whether inflows and purchases continue when the forced demand has already ended.
Why Loss Is Harder to Recover Than It Seems
The deeper the decline, the greater the subsequent growth needed to return to the original amount.
Decline in Value | Remaining from $1,000 | Growth Needed for Recovery |
10% | $900 | 11.1% |
20% | $800 | 25% |
30% | $700 | 42.9% |
50% | $500 | 100% |
Conditional calculation without taking into account commissions, taxes, and borrowed funds. Values are not a forecast.
If an asset first depreciated by 30% and then grew by 30%, the investment did not return to its original value. After the first movement, $700 remains from $1,000. A 30% increase in this amount will only yield $910.
For a trader with leverage, the consequences can be even more serious: the position may close before the market has time to recover.
Three Scenarios for the Coming Months
The scenarios below are not trading signals. Their purpose is to show which data can support or refute different development options.
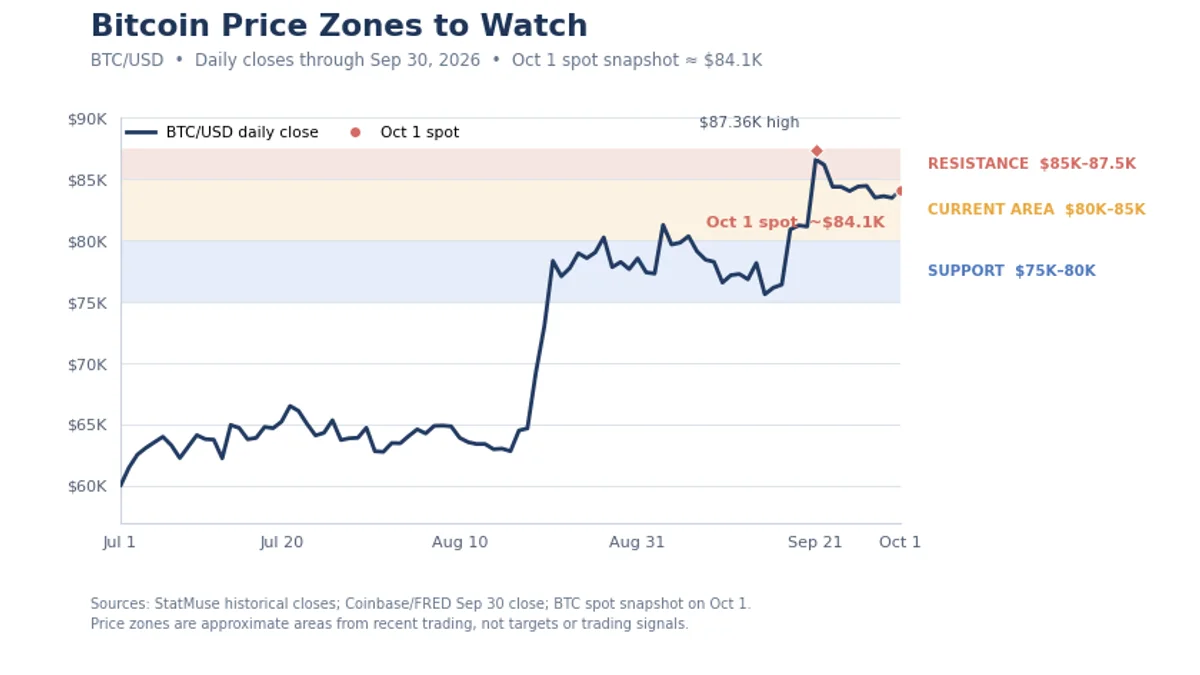
Marked areas of previous price reactions. They serve as benchmarks for scenario testing but are not guaranteed levels of support, resistance, or trade points.
Scenario 1. Growth Continues
For the positive scenario for Bitcoin to develop, it is not enough to simply break above $87,000. It is desirable for the movement to be accompanied by additional signs of demand:
sustained net inflows into spot ETFs;
purchases by several categories of participants, not just one company;
maintaining the price above the passed area after the initial impulse;
absence of a new sharp rise in US bond yields;
weakening of inflationary risks or a softer Fed rhetoric.
In this case, overcoming the area of $85,000–$87,000 may indicate that the recovery is gaining momentum. But the mere fact of a new high does not yet guarantee a sustainable movement. After rapid growth, some participants may lock in profits.
What will refute the scenario: a return below the passed area, large and prolonged outflows from ETFs, worsening attitudes towards risky assets, or unexpectedly tough Fed decisions.
Scenario 2. Price Remains in a Wide Range
Bitcoin may move without a sustainable direction for several weeks or months. For example, buyers will support the price on declines, and sellers will lock in profits after approaching local highs.
In such a scenario, good and bad news will alternate:
fund inflows are replaced by outflows;
inflation does not accelerate but also does not allow the Fed to ease policy;
corporate purchases continue, but they are not enough for sustainable growth;
the price repeatedly returns to the area of $75,000–$85,000.
For a long-term investor, the absence of movement does not necessarily require action. For an active trader, the range means additional risks: frequent false breakouts beyond its boundaries and increased cumulative transaction costs.
What will refute the scenario: a sustainable movement beyond the range, confirmed by demand and several daily or weekly closings, rather than a short-term spike.
Scenario 3. Recovery Ends with a Decline
A negative scenario will become more likely if several factors manifest simultaneously:
ETFs switch to consistent net outflows;
the Fed continues to raise rates;
bond yields and the dollar resume growth;
interest in risky assets decreases;
the price cannot hold after the recent rise;
corporate purchases slow down.
A return below $80,000 by itself will not prove the start of a prolonged decline. But a combination of weak price and deteriorating demand data will be a more significant signal than a single movement on the chart.
With further decline, the market's attention may shift to the area of $75,000, and then to lower zones of previous reactions. This is not a price forecast but a sequence of benchmarks that should be checked as data becomes available.
What will weaken the negative scenario: a quick price recovery, the return of fund inflows, and the absence of further monetary policy tightening.
Scenario | What an Investor Can Assess | What a Trader Can Assess | What Choice to Make |
Growth | Leave the current position unchanged, increase the share of Bitcoin, or divide a new amount into several purchases | Enter a trade immediately or wait for additional signs of continued growth. Pre-determine under what conditions the scenario will no longer be relevant | Buying allows participation in further growth, but after a sharp increase, the risk of acquiring an asset before a correction increases |
Range | Keep Bitcoin in the portfolio and refrain from new purchases until the direction becomes clearer | Wait for the price to break out of the range or trade between its boundaries | Trading within the range can yield results, but frequent trades increase cumulative commission costs |
Decline | Keep the position, reduce its size, or temporarily refrain from new purchases | Reduce the open position, close it according to the plan condition, or refrain from a new trade | Reducing the position limits potential losses but decreases participation in growth if the price unexpectedly recovers |
The table does not offer a universal solution. The same scenario will mean different actions for an investor with a five-year horizon and a trader holding a position for several days.
How to Use Scenario Analysis in Copy Trading
Scenarios help not only to assess the market but also to check whether the strategy of the chosen trader suits the investor. In the Axi Copy Trading app, you can select a trader, set copy parameters, and automatically replicate their trades through a linked MT4 or MT5 account. The trader's profile provides data on profitability, performance history, markets, and performance fees.
Before connecting, it is useful to compare the trader's strategy with your market scenario:
What to Assess | Question Before Copying |
Traded Markets | Does the strategy include BTC or BTCUSD, and how did the trader act during sharp price fluctuations? |
Performance History | How has the strategy's profitability changed, and what periods of decline has it gone through? |
Risk and Trade Size | Do the copy settings match the level of risk the investor is willing to take? |
Commissions | Does the trader have a performance fee, and how will it affect the outcome? |
Copy trading automatically replicates not only profitable but also losing trades. Past performance does not guarantee future results; before connecting, it is worth checking the available risk parameters and commissions. If the copied position is opened through a CFD on BTCUSD, it is a contract for price change, not a purchase of Bitcoin in a personal crypto wallet.
Which Scenario Currently Looks Most Justified
After a notable decline, Bitcoin managed to recover some losses, and the interest of major market participants began to return. New investments through spot ETFs and purchases by companies like Strategy add confidence to the movement. If demand persists, Bitcoin will have more chances to continue growing, although these signals alone do not yet guarantee a sustainable upward trend.
However, confirmation cannot yet be considered final. The weekly ETF result was only slightly positive, part of the movement was amplified by short position liquidations, and the Fed raised the rate for the first time in three years and allowed for further policy tightening.
Fidelity's research also points out that a strong August rebound does not yet guarantee the end of the bear period.
Therefore, the most cautious assessment looks like this: Bitcoin has moved from a clear decline to testing the recovery scenario, but the market still needs to confirm the sustainability of demand.
In the coming weeks, it is worth monitoring four indicators:
weekly flows into spot ETFs;
price reaction in the area of $85,000–$87,000;
inflation and further Fed decisions;
Bitcoin's behavior after the wave of short position closures ends.
Currently, Bitcoin has grounds for continued growth, but there are also obstacles that can quickly change the picture. Fund inflows, corporate purchases, and demand recovery support the positive scenario. A higher rate, inflationary risks, and flow instability limit this conclusion.
Therefore, it is important to check the conditions. If demand persists and the price holds the passed areas, the growth scenario receives additional confirmation. If inflows turn into outflows and monetary policy becomes tighter, the initial assessment needs to be revised.
Related articles