


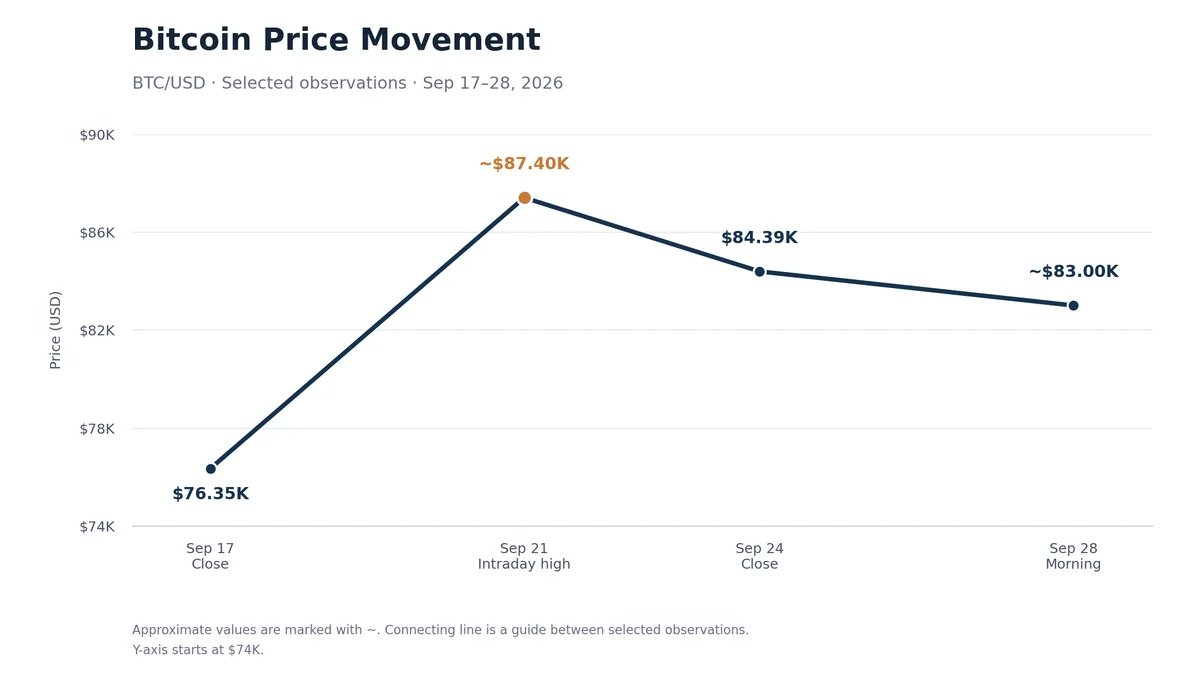
Between the closings on September 17 and 24, Bitcoin appreciated by approximately 10.5% — from $76.35K to $84.39K. On September 21, the price briefly rose to about $87.4K, and on the morning of September 28, it was trading around $83K. This is about 5% below the peak but still above the level of September 17. We analyze how ETF inflows, short position liquidations, and the macroeconomic background influenced the movement — and why a pullback began after the rise.
Main Source of Demand – ETF Inflows
During the week from September 21 to 25, American spot BTC-ETFs received about $2.4 billion in net inflows — the highest weekly figure since October 2025. The previous week's net inflow was only $6.2 million. The new investments returned the cumulative net flows in the funds for 2026 to a positive zone after an outflow of about $5.8 billion in mid-July.
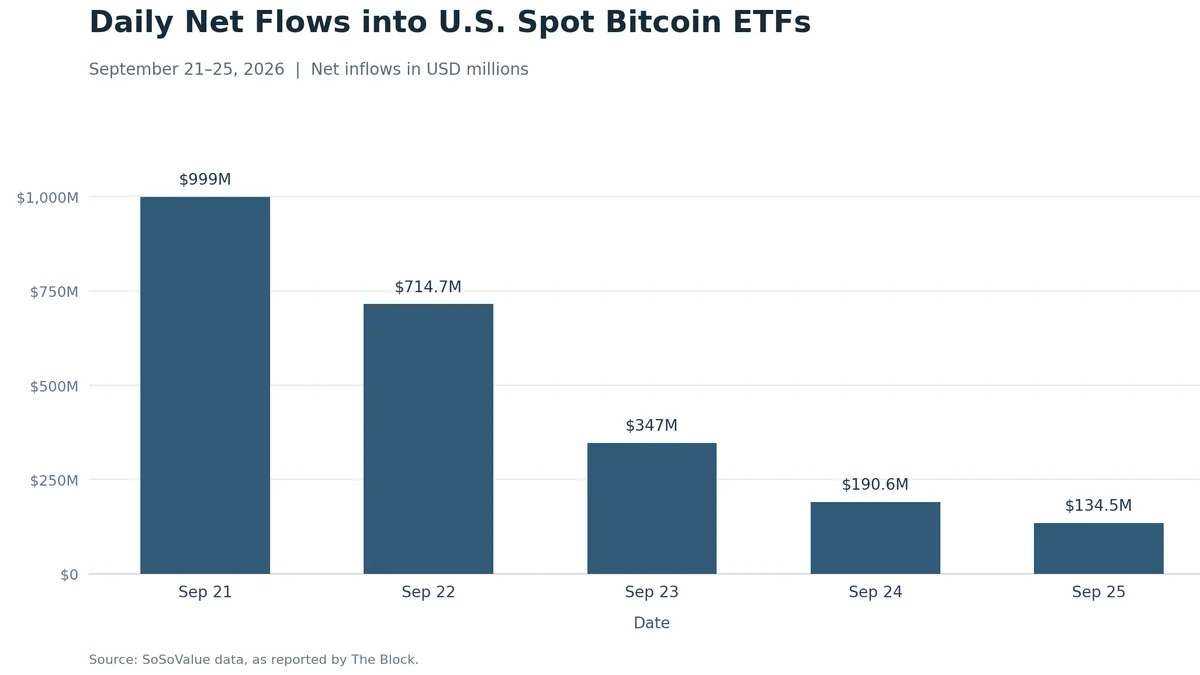
The largest daily inflow occurred on Monday — $999 million. Then the values decreased each trading day: $714.7 million on Tuesday, $347 million on Wednesday, $190.6 million on Thursday, and $134.5 million on Friday. The Monday figure accounted for about 42% of the weekly total.
It is important to note that the ETF data covers the period up to September 25, while the price increase at the beginning of the article is calculated based on the closings of September 17 and 24. Therefore, the weekly inflows show the overall scale of demand in the funds but do not explain the price movement only for the period up to the 24th.
The total trading volume of ETFs for the week was $15 billion compared to $16.2 billion the previous week. Inflows and trading volume measure different indicators, so they should not be mixed. Moreover, ETF flows do not cover all Bitcoin transactions on spot platforms and derivatives markets. It is a notable indicator of demand through exchange-traded funds, but it does not prove that the funds caused the entire growth.
ETF flows are a notable indicator of demand through exchange-traded funds, but they do not cover all Bitcoin transactions on spot platforms and derivatives markets. Therefore, the $2.4 billion sum helps to understand the scale of investor activity in the funds, but it does not prove by itself that it caused the entire growth.
Short Positions Accelerated the Movement
If the price rises against a trader with a short futures position, their collateral may become insufficient. In this case, the exchange forcibly closes the contract, usually through a counter-purchase. Mass requests to close short positions can amplify the movement, although it does not mean that exchanges necessarily buy BTC on the spot market.
According to CoinGlass, on September 21, about $746.6 million worth of positions were liquidated in the crypto market in a day. Almost $648 million of them were short positions, about $277.5 million were short positions on Bitcoin. These figures cover different crypto assets, so it is incorrect to say that all liquidations occurred specifically in BTC.
However, the growth cannot be reduced solely to a 'short squeeze.' CoinDesk reported that the total open interest in the crypto market increased by 7.59% to $156 billion. Open interest shows the volume of open contracts. Its growth amid mass liquidations indicates that closed positions could be replaced by new ones, and participants continued to increase leveraged activity. Therefore, the market was not just getting rid of bets on a decline — some traders were entering new positions.
Price rises → short positions are forcibly closed → exchanges buy BTC → movement can accelerate.
Macroeconomic Background Initially Supported Growth, Then Pressured the Price
At first glance, the dynamics contradicted the actions of the Federal Reserve System. On September 16, the Fed raised the rate by 0.25 percentage points to 3.75–4%. A higher rate usually increases the attractiveness of interest-bearing assets compared to those that do not generate income, including Bitcoin.
However, the Fed rate is not the only important factor. It sets a benchmark for short-term rates, while the yield on ten-year Treasury bonds changes under the influence of investor expectations and demand for the bonds themselves. On September 21, the yield on ten-year bonds fell below 5%, oil became cheaper, and U.S. stock indices rose: Nasdaq added 2.26%, S&P 500 – 1.49%. Bitcoin appreciated by more than 6% on the same day. This indicates an improvement in sentiment towards risky assets in general, not just cryptocurrencies.
Art Hogan, chief market strategist at B. Riley Wealth, noted that on that day, oil and bond yields “changed their role from a headwind to a tailwind for the market – at least in the short term.” His assessment referred to the situation on September 21. Just a few days later, the market picture changed.
By September 24, the yield on ten-year Treasury bonds rose above 5%, and oil became more expensive. Market expectations of further tightening of central bank policies also intensified. By the morning of September 28, the yield on U.S. ten-year bonds again exceeded 5%. In such conditions, investments in non-interest-bearing assets become less attractive for some market participants.
Regulatory News Supported Sentiment but Did Not Resolve the Issue
On September 15, the U.S. Senate did not advance the CLARITY Act – a bill that was supposed to establish more detailed rules for the digital asset market. The vote ended with a score of 50–49, while 60 votes were required for advancement. This was a setback for the law's supporters and a source of uncertainty for the crypto industry.
Two days later, the SEC approved a temporary conditional exemption for limited trading of certain tokenized U.S. stocks on blockchain platforms. This could be perceived by the market as a sign that the regulator is ready to consider new models for trading digital assets. However, the decision concerned specific tokenized stocks and platforms, and did not change the legal status of Bitcoin or replace the CLARITY Act bill.
Why a Pullback Began After the Rise
The pullback formed against the backdrop of a no longer so favorable macroeconomic picture. Bond yields again exceeded 5%, oil prices were rising, and news of weak progress in U.S.-Iran negotiations heightened concerns about inflation and geopolitical uncertainty. On September 28, Bitcoin fell to about $83K. Along with it, other major cryptocurrencies were also declining. Market reviews also noted profit-taking after two weeks of growth.
By this time, ETF inflows remained positive throughout the week, but the dynamics noticeably decreased day by day. Therefore, it is more accurate to say that institutional demand did not disappear, but that strong weekly investments did not prevent a short-term decline. The price was simultaneously influenced by fund flows, leveraged positions, and changes in risk demand.
The nearly 10% rise and subsequent pullback are explained by a combination of factors. ETF inflows showed notable demand, short position liquidations could have accelerated the rise, and the decline in bond yields and oil supported the market at the beginning of the week. Later, the macroeconomic background became less favorable, and the pace of ETF inflows weakened. This sequence explains the movement better than trying to find a single news event that supposedly caused all the rise or all the fall.
Related articles