Why Memory Prices Have Increased and How Long the Rise Will Last
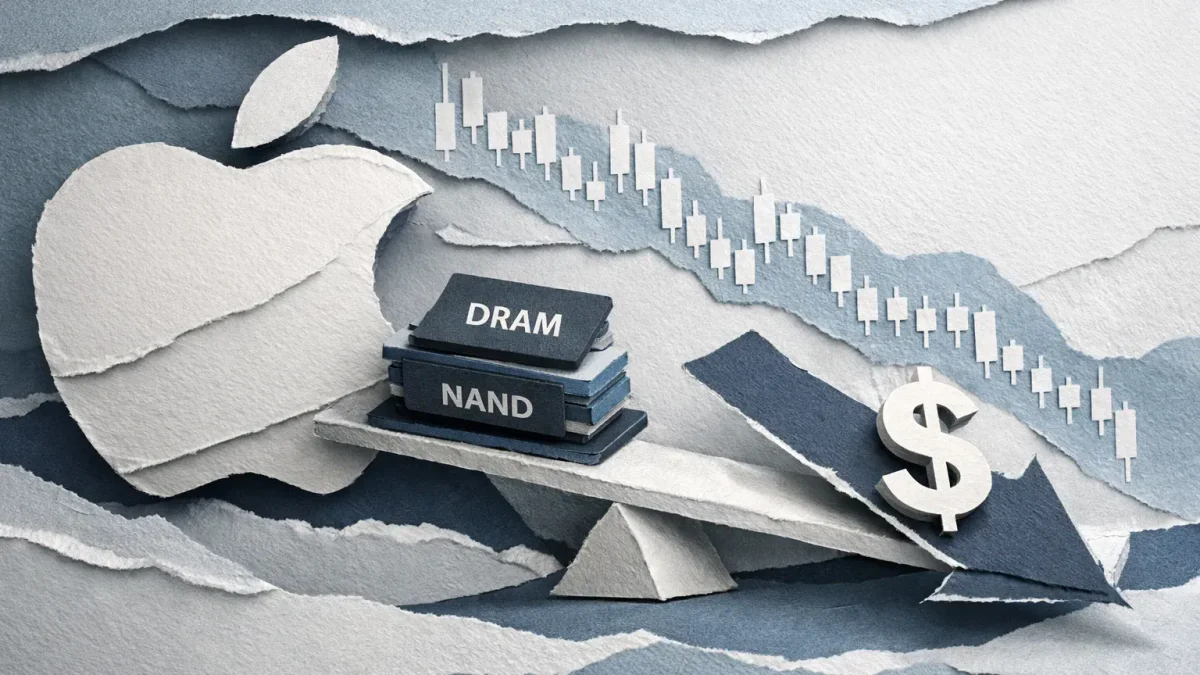
The global semiconductor market is experiencing a shift in demand structure, particularly noticeable in the memory chip segment. Component manufacturers are increasingly focusing on server equipment and artificial intelligence infrastructure, while the production of memory for consumer electronics faces constraints. For Apple, Samsung, and other device manufacturers, rising memory prices mean increased procurement costs and the need to revise pricing policies.
The production cost of devices is primarily influenced by two types of memory. DRAM provides temporary data storage during application operation, while NAND Flash is used for permanent information storage in smartphones, computers, and tablets. Both types of memory are essential for the production of iPhones, Macs, and iPads, so changes in their cost directly affect the economics of Apple's hardware business.
According to TrendForce's forecast published on September 30, 2026, contract prices for traditional DRAM in Q4 may rise by 10–15% compared to the previous quarter, and for NAND Flash by 15–20%. These are industry forecasts, not confirmed changes in procurement prices directly for Apple.
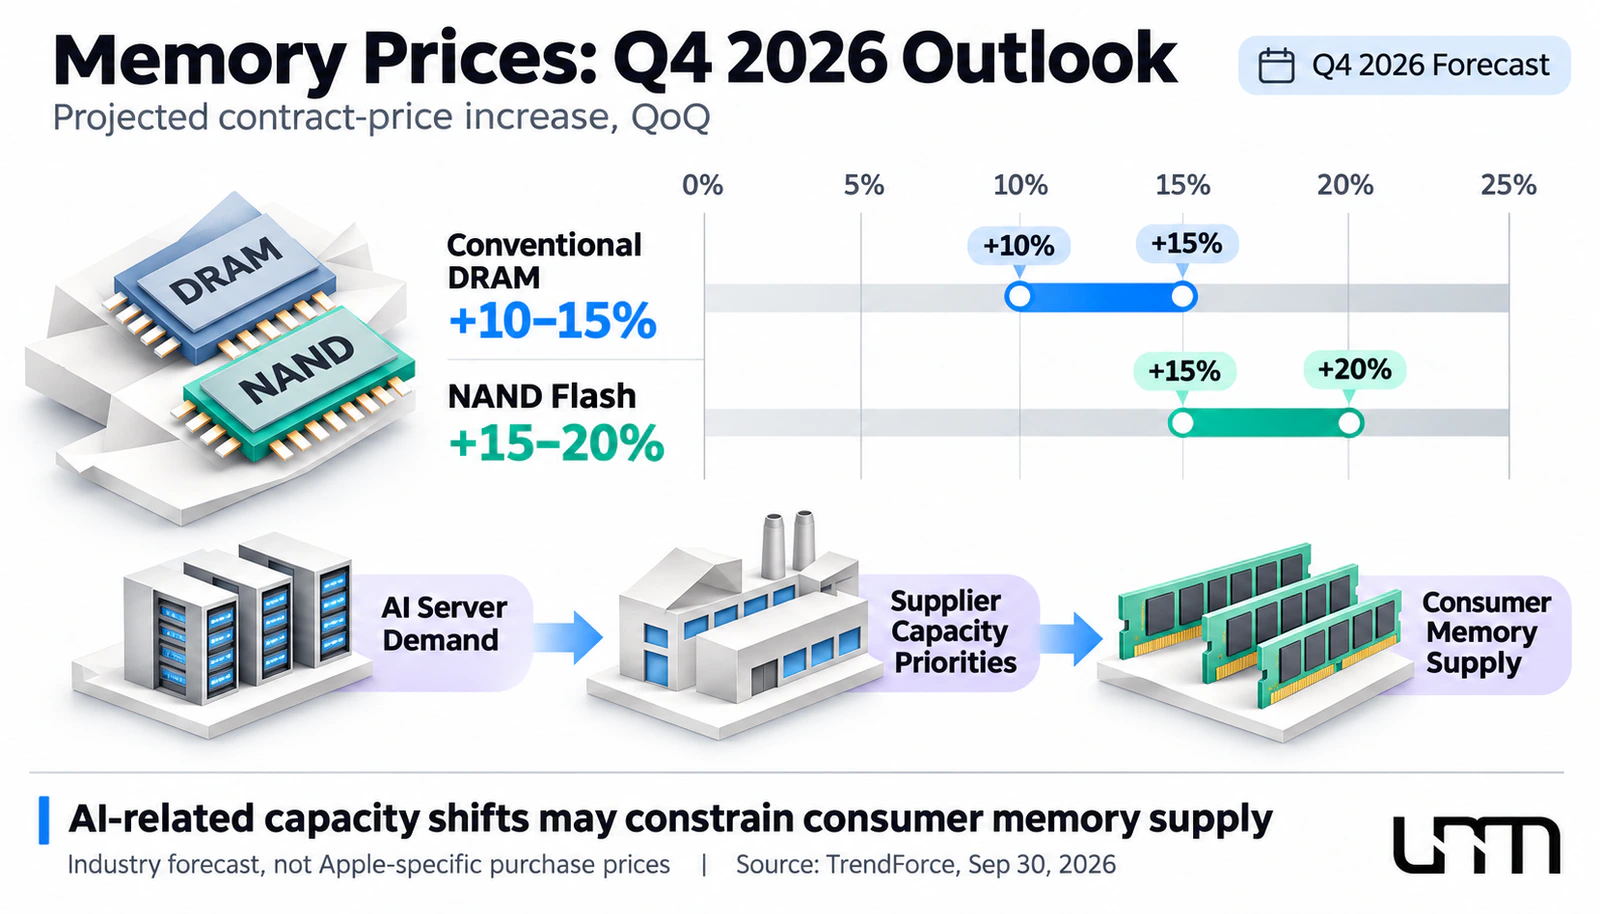
The reason for this growth is not only the increase in the number of servers. Memory manufacturers are reallocating production capacity in favor of more profitable components for data centers. High demand for AI memory, including server DRAM and specialized high-speed memory, limits the ability to expand the production of certain types of components for smartphones and personal computers.
Meanwhile, demand for consumer devices remains less stable. A situation arises where the increase in component costs is not accompanied by a comparable increase in sales of end electronics. The production cost of electronics rises, although manufacturers' ability to pass on additional costs to consumers remains limited.
Long-term contracts with suppliers help large customers partially mitigate the impact of price fluctuations, but do not eliminate the problem. When stocks of components purchased at previous prices run out, manufacturers have to account for new contract prices for memory in the production cost of products.
TrendForce notes a persistent shortage of chips in certain segments of the memory market, primarily in the server direction. Additionally, Apple's management expects further increases in procurement prices even after the December quarter. This does not mean that component costs will rise at the same rate throughout 2027, but it indicates the risk of prolonged pressure on electronics manufacturers.
To assess the duration of such a period, it is necessary to consider not only current demand but also memory manufacturers' plans to expand capacity. As long as the priority remains to meet the needs of data centers, the supply of components for consumer devices may recover more slowly.
Related on UNUM: “Export Price of DRAM Chips Increased by 401% Over the Year”.
How Rising Component Costs Affect Apple's Production Costs
To assess how the production costs of iPhones and other Apple devices are changing, it is necessary to distinguish between the price of an individual chip and total manufacturing expenses. Even a significant increase in the procurement cost of DRAM or NAND Flash does not mean that the production of a smartphone or computer will become more expensive in the same proportion.
The production cost of a device consists of the processor, display, cameras, memory, casing, battery, assembly, and other expenses. The share of each component depends on the model, configuration, and procurement conditions. Therefore, the impact on profit is determined not only by the rate of price growth but also by the proportion of production costs occupied by memory.
Let's consider a hypothetical example. If the production of a device costs $500, of which $50 is for memory, a 20% increase in its cost will raise expenses by $10. The total production cost will increase to $510, which is only a 2% rise.
This is an illustrative calculation, not an estimate of the production cost of a specific Apple model. To determine the actual share of memory, an analysis of the device's bill of materials (BOM) based on independent research is necessary.
At the company-wide level, even a relatively small change in production costs becomes significant. Apple sells devices in large volumes, so an increase in expenses by a few dollars per unit can lead to substantial additional costs for the quarter.
The company's management is already employing several methods to mitigate such pressure. During the conference call for the fourth quarter of fiscal 2026, CEO John Ternus noted that Apple partially offset the increase in memory costs through previously acquired inventory, reduced costs of other components, and changes in retail prices for a number of devices.
What we are witnessing with memory prices right now is unprecedented.
According to management, prices for several Mac and iPad products were adjusted at the end of June, and for iPhone in September. However, such measures have limitations: further price increases for devices may restrain demand, especially in regions where consumers are sensitive to the cost of electronics.
In addition, the benefits of inventories formed at lower purchase prices are gradually diminishing. According to Apple's financial statements, the cost of inventories rose from approximately $11.09 billion at the end of the June quarter to $14.54 billion at the end of September.
Some of the previously purchased memory helps temporarily contain the rise in cost of goods sold. However, the overall inventory cost does not reveal the volume of components acquired at lower prices, making it difficult to determine how long the company can leverage this advantage.
Purchase commitments also play an important role. During the conference call, Ternus reported that Apple's manufacturing purchase commitments increased by $33 billion between the end of the June and September quarters. This indicates an effort to secure future supplies, but does not show at what prices the company is acquiring memory.
The main risk for Apple is not a single quarterly increase in chip prices, but the potential accumulation of costs. If purchase prices continue to rise and compensation opportunities diminish, pressure on profitability will become more noticeable.
Apple's financial results show growth, but margin forecast worsens
Apple's report for the fourth quarter of fiscal 2026, which ended on September 26, demonstrated steady business growth. Revenue reached $114.5 billion, up 12% compared to the same period last year. Net income was $30.7 billion, and diluted earnings per share (EPS) rose by 14% to $2.10.
For the entire fiscal 2026, Apple's revenue reached a record $478.8 billion, up 15%. Annual earnings per share amounted to $8.98, approximately 20% higher than the previous year's result.
The main contributors to quarterly growth were the iPhone and Mac. Revenue from smartphone sales increased by about 17% to $57.6 billion, while Mac computer sales brought in $10.8 billion, nearly 24% more than last year's result. The services business also set a record, reaching $31.6 billion in revenue.
However, strong sales figures do not mean that production costs are under control. The main warning for investors was the gross margin forecast—the portion of revenue remaining after deducting the cost of goods and services sold.
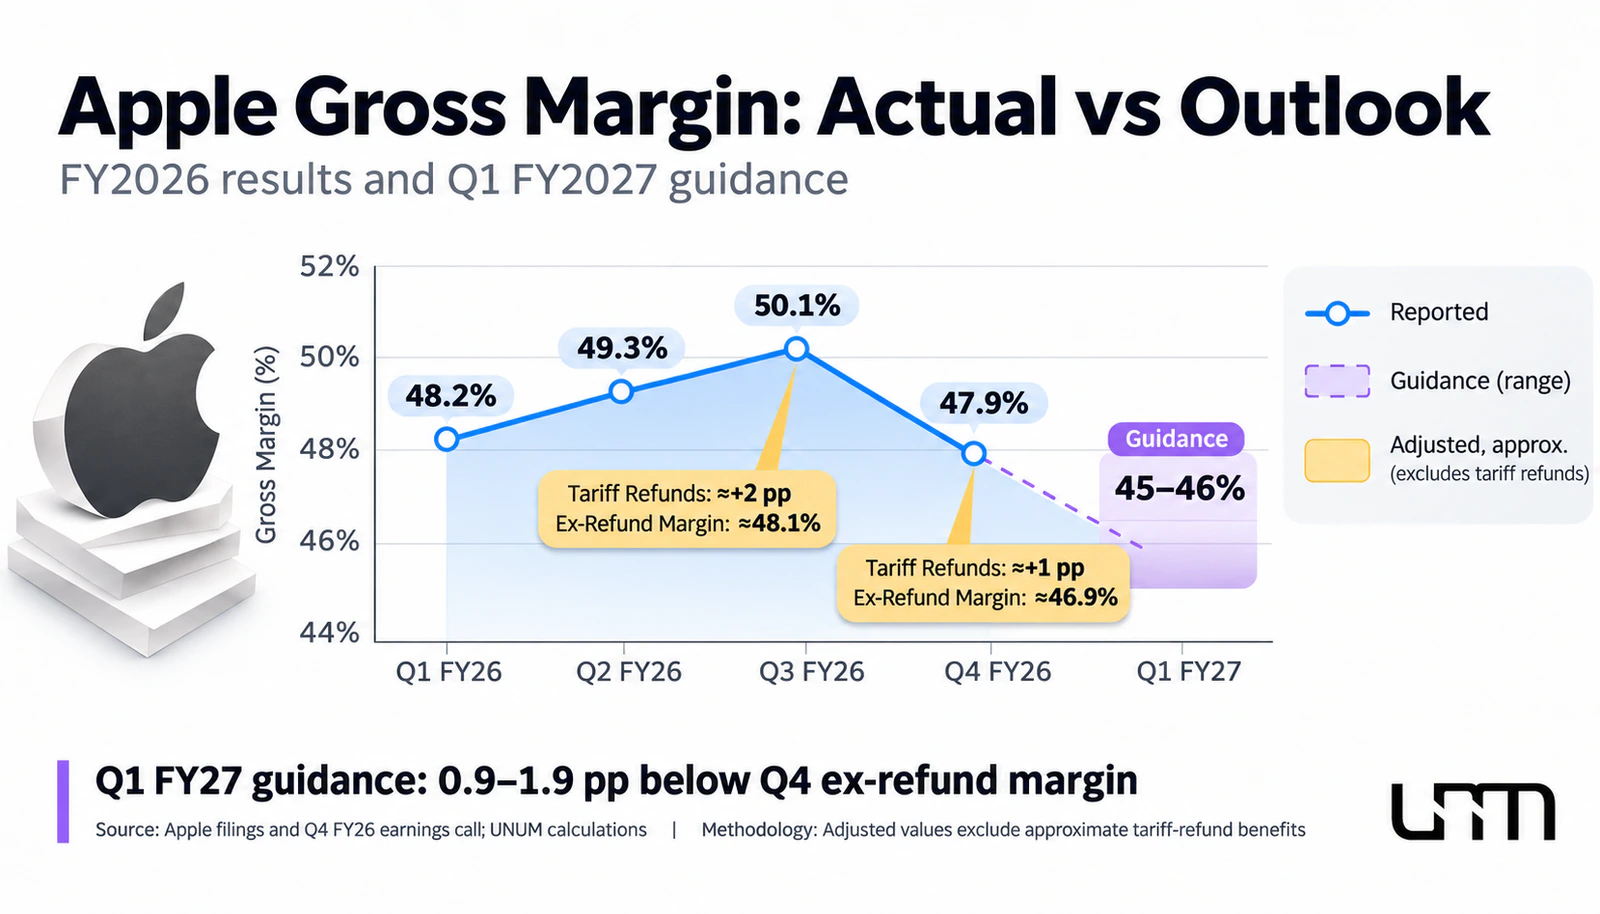
In the September quarter, Apple's gross margin was 47.9%. For the first quarter of fiscal 2027, which will end in December 2026, management forecasts a decrease to 45–46%.
The September result included a positive effect from the return of customs duties of about one percentage point. Without this one-time benefit, the gross margin would have been approximately 46.9%.
Comparing the actual 47.9% directly with the forecasted 45–46% without such an adjustment would be incorrect. Considering the return of duties, the expected deterioration is approximately 0.9–1.9 percentage points relative to the adjusted September base.
According to CFO Kevan Parekh, the main part of the expected sequential margin decline is related to the increase in memory costs. Additional pressure is created by expenses for the development and launch of Siri AI.
Importantly, Apple's revenue forecast for the December quarter anticipates growth of 7–10% year over year. Thus, management expects a decline in profitability even amid further sales increases.
How significant are these changes for financial results? Assuming hypothetical quarterly revenue of $115 billion, each percentage point of gross margin corresponds to approximately $1.15 billion in gross profit. A two-percentage-point margin decline with unchanged revenue would mean a reduction in gross profit of about $2.3 billion.
This calculation is not a forecast of Apple's net income, as it does not account for changes in sales, operating expenses, taxes, and other indicators. However, it shows why even relatively small fluctuations in profitability matter for a company of this scale.
The impact on earnings per share depends on additional conditions. Assuming unchanged quarterly revenue of $115 billion, a weighted average diluted share count of 14.6 billion, and an effective tax rate of 17%, a one-percentage-point drop in gross margin would reduce the estimated EPS by approximately $0.065.
The 17% rate aligns with the guidance Apple provided for the December quarter. Revenue and share count are used as conditional constants rather than an exact company forecast.
Under these assumptions, a two percentage point decline in margin could reduce quarterly earnings per share by about $0.13. The actual result will depend on operating expenses, taxation, sales structure, and stock buybacks.
As a result, Apple's financial picture becomes ambiguous. The company's revenue continues to grow, but some of the additional income may be absorbed by rising costs. The main question for the next quarterly reports is whether Apple's profits can grow fast enough to offset the increase in production costs.
Will price increases for iPhone and Mac help maintain profits?
One of Apple's main advantages is its ability to sell devices in the premium segment, where consumers pay not only for technical specifications but also for software, service ecosystem, and brand recognition. This model gives the company more opportunities to offset rising costs by changing retail prices.
In 2026, Apple has already used this tool by raising the cost of several devices. However, the impact of such a decision on financial results depends on consumer reaction. If the increase in average selling price offsets additional expenses without significantly reducing demand, profitability can be maintained. If consumers start delaying purchases or choosing more affordable configurations, the effect is less favorable.
When analyzing pricing policy, three interrelated factors must be considered.
Average selling price. Sales of more expensive models and configurations with increased memory capacity can support revenue even with moderate sales volume dynamics.
Demand elasticity. Price increases can influence consumer decisions, especially in emerging markets and during periods of slowing consumer spending.
Competitive environment. Samsung and other Android device manufacturers face similar cost increases, so consumers' ability to switch to cheaper alternatives also depends on competitors' pricing policies.
The sales structure plays a separate role. For example, increasing the share of expensive iPhone models can improve average revenue per device but simultaneously lead to higher costs for more complex components. Therefore, a high average check does not guarantee an increase in gross margin.
There is also a long-term constraint. Apple is interested not only in profit from a single sale but also in expanding the installed base of devices, which ensures subsequent service revenue. Excessive price increases may slow down the upgrade cycle for smartphones and computers, potentially affecting other business areas over time.
Thus, iPhone and Mac pricing becomes an important tool for protecting Apple's profitability, but its effectiveness depends on how resilient demand for premium devices remains.
For investors, it's important to watch not only price changes but also the combination of three indicators: device revenue, sales growth rates, and the hardware segment's gross margin. If revenue continues to increase alongside margin stabilization, it will be evidence of an effective pricing strategy.
Related on UNUM: “iPhone 18 Pro may see a $100 price increase due to rising memory costs”.
Services and iPhone Duo may offset pressure on the hardware business
The growth of the service segment allows Apple to partially reduce its financial results' dependence on the cost of individual devices. Unlike smartphone and computer production, many digital services do not require memory purchases for each additional customer, although they have their own technological and operational expenses.
In the fourth quarter of fiscal 2026, Apple's service revenue reached $31.6 billion, increasing by about 10% year-over-year. The gross margin for this segment was around 76%. For comparison, the device segment's gross margin was at 37.2%.
This difference is significant for overall profitability. When the share of services in revenue increases, the overall gross margin can be supported even if individual device categories' performance worsens.
However, the service business cannot be considered completely immune to rising technological costs. The development of artificial intelligence requires additional computing power, cloud infrastructure, and model maintenance.
According to CFO Kevan Parekh, expenses related to Siri AI development are also factored into the gross margin forecast. Expanding cloud AI functions may create new monetization opportunities but also increase service delivery costs.
It is not yet known to what extent future monetization of AI functions will be able to offset additional expenses. Therefore, including significant revenue growth from paid Siri AI in financial forecasts without confirmed rates, implementation timelines, and user demand data is premature.
Another factor remains the new foldable iPhone Duo. The device expands Apple's premium lineup and has the potential to increase the average selling price of smartphones. Initial customer interest was high, but the company faced supply constraints, making it difficult to meet demand.
For financial analysis, it's important to distinguish between high demand and actual sales. A product shortage does not bring additional revenue to the company if the order cannot be fulfilled within the reporting period. Moreover, production constraints may be accompanied by additional expenses and a shift of some sales to subsequent quarters.
Thus, services and new premium devices indeed expand Apple's ability to maintain profitability. However, none of these directions automatically eliminate the pressure on the hardware business, which still forms a large part of the overall revenue.
What Rising Costs Mean for Apple Shares
For the stock market, not only the financial result is important, but also its alignment with expectations. A company can show record revenue and exceed analysts' forecasts, yet its shares may still decline if the new profit targets are weaker than expected.
The dynamics of AAPL's stock prices following Apple's financial report on November 2 showed how sensitively investors react to profitability forecasts.
The shares ended the main trading session at $338.32, down 1.83%. After the announcement of results and management comments, the quotes experienced additional pressure. According to Reuters, during the conference call, the decline reached about 4%, after which some losses were recovered.
The market reaction cannot be explained solely by the rising cost of memory. Investors simultaneously assessed the gross margin forecast, service business growth rates, supply constraints, expenses on Siri AI, and expected revenue dynamics.
Nevertheless, profitability can become an important factor in revising EPS forecasts. If the company earns less gross profit from each dollar of sales, analysts have to assess how much additional expenses can be offset by revenue growth, cost optimization, or changes in business structure.
This also affects the stock price through the P/E multiplier — the ratio of market price to earnings per share. Its forecast variant, forward P/E, is calculated based on expected earnings for a future period.
According to StockAnalysis, as of November 2, 2026, Apple's forward P/E was about 35.4. For comparison, at the end of fiscal 2025, the figure was at 33.0, and at the end of 2024 — about 31.5. In 2022 and 2023, the corresponding values were even lower — about 24.3 and 26.7.
Thus, Apple shares are valued higher relative to expected earnings than at the end of several previous years. This does not necessarily mean the company is overvalued: the market may factor in the steady demand for devices, high profitability of the service business, and Apple's ability to generate cash flow. However, a high valuation increases the sensitivity of quotes to deteriorating forecasts.
An additional benchmark is provided by comparison with other large tech companies. According to the same source, Microsoft's forward P/E as of November 2 was about 24.6, noticeably lower than Apple's figure.
However, directly comparing multipliers without considering differences in growth rates, business structure, and capital expenditures is incorrect. A significant portion of Apple's revenue comes from device sales, which are sensitive to component costs. Microsoft is more focused on software and cloud services, which are subject to different cost factors.
Therefore, the difference in multipliers does not prove that one company is preferable to another, but helps assess investors' requirements for future earnings.
The main risk lies in the simultaneous deterioration of two indicators: the forecasted earnings per share and the multiplier that the market is willing to pay for it.
For example, if the EPS forecast decreases by 10%, and the stock price remains unchanged, the forward P/E increases by about 11.1%. The stock becomes more expensive relative to expected earnings. To maintain the previous multiplier, all else being equal, the market price would need to decrease by the same 10%.
If the multiplier that investors are willing to pay for future earnings also decreases simultaneously, the pressure on quotes may be stronger. However, such a calculation only reflects the mathematical relationship between earnings and stock valuation and is not a forecast of market price.
Meanwhile, Apple retains factors of financial stability. For the September quarter, the company generated about $28.1 billion in operating cash flow and allocated approximately $24 billion for share buybacks. Another $3.9 billion was spent on dividends and related payments.
Share buybacks reduce the number of shares outstanding and, all else being equal, support the EPS figure. But this does not solve the cost problem: increasing earnings per share by reducing the number of shares must be distinguished from growth in operational efficiency.
An additional benchmark is the free cash flow, which shows how much cash remains after capital expenditures. Its dynamics allow assessing the company's ability to finance investments, dividends, and buybacks without excessively increasing debt burden.
For a comprehensive assessment of AAPL, the forecasted P/E should be compared with historical values, expected EPS growth rates, and cash flows. A high market valuation can persist for a long time, but as financial forecasts worsen, the room for error for the company becomes smaller.
Current stock quotes and market dynamics can be tracked in the "Stock Quotes" section on UNUM.
Three Scenarios for Apple in the Coming Quarters
The financial outlook for Apple in 2027 will largely depend on how quickly memory prices stabilize and whether the company can offset additional costs. Changes in cost of goods sold should be considered alongside consumer demand, sales structure, and the development of the services business.
Based on current data, three scenarios can be identified. These are not stock price forecasts but illustrate the conditions under which the company's financial performance may develop along different trajectories.
Positive Scenario — Margin Pressure Eases
The growth in contract prices for DRAM and NAND Flash slows, and Apple's purchasing costs gradually stabilize. Consumer demand remains strong, price increases do not lead to a significant drop in sales, and the services business continues to increase its contribution to overall profit.
In this scenario, the gross margin could be closer to the upper end of the current forecast — 46%. Its further recovery will depend on memory prices, sales structure, and service development costs.
Confirmation of the positive scenario will be seen in improved management forecasts, stabilization of device profitability, and continued positive EPS dynamics.
Base Scenario — Revenue Growth Accompanied by Increased Costs
Memory prices remain high, but their growth rate gradually decreases. Apple partially offsets costs by adjusting device prices, managing procurement, and developing services.
In this case, the gross margin may be around the middle of the forecast range — 45.5%. Sales growth will continue to support the absolute profit size, but profitability recovery will require additional time.
Key indicators of this scenario will be the maintenance of revenue forecasts, no significant deterioration in demand, and gradual stabilization of procurement costs.
Negative Scenario — Costs Grow Faster Than Revenues
Memory shortages persist, and purchasing prices continue to rise. The advantages of old stock diminish, further retail price increases limit demand, and AI infrastructure development requires additional expenses.
In this scenario, the gross margin could approach the lower end of the forecast — 45%. If cost pressure intensifies, profitability may decline further in subsequent quarters, leading to a revision of EPS expectations.
Main signals of the negative scenario will be worsening management forecasts, slowing device sales, and further increases in component costs.
How Different Margin Levels Can Affect Apple's Profit
For quantitative comparison, consider a hypothetical model with quarterly revenue of $115 billion. The calculation base assumes a gross margin of about 46.9%, excluding approximately one percentage point of positive tariff return effect from the actual 47.9% of the September quarter.
Assume operating expenses remain unchanged, the weighted average number of diluted shares is 14.6 billion, and the effective tax rate is 17%. The latter corresponds to Apple's guidance for the December quarter.
Scenario | Gross Margin | Change in Gross Profit from Base | Change in Quarterly EPS from Base |
|---|---|---|---|
Positive | 46.0% | −$1.04 billion | −$0.059 |
Base | 45.5% | −$1.61 billion | −$0.092 |
Negative | 45.0% | −$2.19 billion | −$0.124 |
Source: UNUM calculations based on Apple reports and model assumptions. Values are rounded.
The difference between the positive and negative scenarios amounts to about $1.15 billion in gross profit for the quarter and approximately $0.065 EPS with the same revenue. If such a difference were to persist for four consecutive quarters, the annual effect would be about $0.26 earnings per share.
However, annual extrapolation is purely illustrative. Apple's sales seasonality, tax rate changes, sales structure, and expenses for new products can significantly alter actual results.
All three margin levels in the table are within the company's published forecast for the December quarter. These are sensitivity analysis scenarios of the financial model, not standalone forecasts of their likelihood. In subsequent quarters, the actual margin may fall outside the considered range.
These calculations help assess financial risks, but a full forecast of Apple's stock requires additional assumptions about future earnings, cash flow, and market multiples.
Scenario analysis shows that the same increase in memory costs can have different consequences. If sales and service revenue grow faster than additional expenses, Apple's profit can continue to rise. However, if costs begin to outpace revenue growth, even record revenue ceases to be a sufficient guarantee of improved financial results.
Key Metrics for Investors to Watch
The upcoming quarterly reports from Apple will allow us to check how successfully the company adapts to changing conditions in the components market. To assess the situation, it is important to monitor not just one indicator, but a group of interconnected financial and industry data.
Contract prices for DRAM and NAND Flash. Quarterly updates from TrendForce will help assess the overall direction of the memory market. A slowdown in price growth may indicate easing pressure, although Apple's actual purchasing conditions may differ from industry trends.
Apple's gross margin. The main near-term benchmark remains the forecast of 45–46% for the December quarter. Subsequent forecasts will show whether management expects a recovery in profitability.
Hardware business margin. Its dynamics will allow us to assess how much the increase in retail prices and changes in sales structure offset the rise in device costs.
Revenue from iPhone and Mac. Sustained growth while maintaining profitability will indicate the effectiveness of the pricing strategy. A slowdown in sales amid rising costs will be an additional risk factor.
Service revenue. It is necessary to compare the growth in service revenue with its gross margin, especially against the backdrop of the development of cloud AI functions.
EPS forecasts and AAPL valuation. Changes in earnings expectations should be compared with the dynamics of forward P/E, free cash flow, and share buyback volumes.
Comments from management on inventory levels and new purchasing commitments will be of particular importance. If memory costs continue to rise and the effect of previously acquired components diminishes, this could impact profitability with a delay of several quarters.
For investors and traders, it is also important to distinguish between the short-term reaction of stock prices to earnings reports and long-term changes in the company's financial model. A one-time margin decline does not necessarily indicate a sustained business deterioration, but a series of negative earnings forecast revisions can significantly alter Apple's market valuation.
Two conditions are particularly important for the coming quarters. First, whether the company can maintain its gross margin within the forecast range without a significant deterioration in demand. Second, whether analysts will maintain EPS growth expectations after the full impact of higher purchasing prices is reflected in the reports.
The main question is whether Apple can maintain the advantage of its business model amid increased purchasing expenses. The growth of the service segment, steady demand for premium devices, and significant cash flow provide the company with room to adapt, but do not eliminate the hardware business's dependence on the components market.
As a result, expensive memory becomes a test of Apple's ability to turn revenue growth into profit growth. For assessing investment risks and AAPL's prospects, the dynamics of DRAM and NAND Flash prices are crucial, as well as how additional expenses impact gross margin, EPS, and investor expectations.
This material is prepared solely for informational purposes and does not constitute financial advice or investment recommendations.