Bitcoin approaches $83,000 after a wave of liquidations
On the morning of October 19, 2026, Bitcoin was trading around $82,700. After several days of decline, the cryptocurrency is trying to regain its position; however, the market structure is significantly different from what was observed at the beginning of the month. The current Bitcoin rate reflects a weakening of seller pressure but does not yet indicate how actively buyers are returning.
On October 15, the BTC price fell below $81,000. During the Asian session, Bitcoin was trading around $80,764, losing 3.6% in a day. The sell-off was accompanied by a decline in Asian stock indices and a deterioration in investor sentiment towards risky assets. Additional pressure was created by concerns about US inflation and the Federal Reserve's future interest rate policy.
The consequences for the cryptocurrency derivatives market were particularly noticeable. According to CoinGlass, cited by The Block, in the 24 hours preceding the publication, the volume of liquidations in the crypto market reached $951.4 million, including $876.3 million in long positions. This means that the majority of forced closures affected traders who were counting on continued growth.
Rick Maeda, head of markets at the analytical platform Laevitas, noted:
Everything indicates that a significant portion of the leverage has already been removed from the market.
The expert also emphasized that the key question now is the return of spot demand amid ongoing macroeconomic pressure.
The event can be seen as an episode of deleveraging—a mass closure of positions opened with borrowed funds. The forced closure of long positions intensified Bitcoin's decline but simultaneously reduced some of the previously accumulated risks.
This is where the line is drawn between a short-term price recovery and the formation of a sustainable upward trend. After massive liquidations, seller pressure can temporarily weaken, allowing Bitcoin to rise even without a significant influx of new capital.
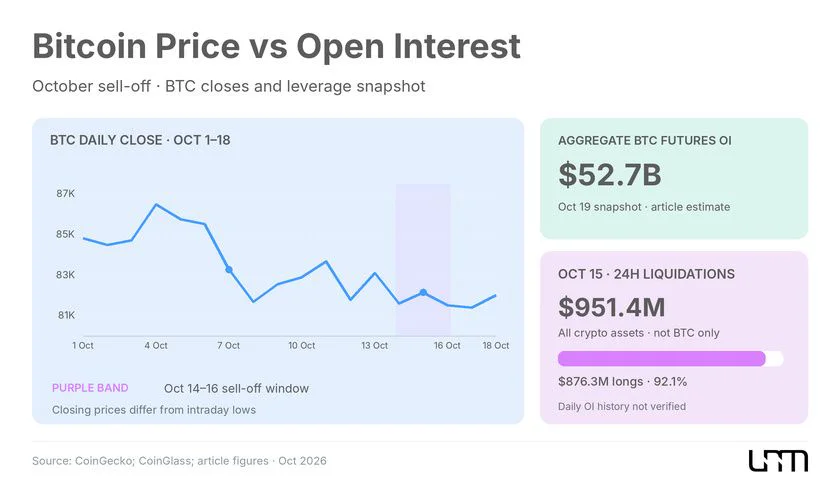
Leverage has decreased, but the derivatives market remains large
One of the key indicators of the futures market's condition is open interest. It reflects the volume of active contracts that participants have not yet closed, and when measured in dollars, it shows their total nominal value.
An increase in Bitcoin's open interest indicates a rise in the volume of active obligations, but it does not in itself indicate a predominance of buyers. Each futures contract involves a long and a short side, so changes in open interest need to be analyzed alongside price, funding rates, and trading activity.
The scale of the October sell-off shows how significant a risk factor Bitcoin leverage remains. When using borrowed funds, even relatively small price movements against a position can lead to its forced closure, increasing volatility.
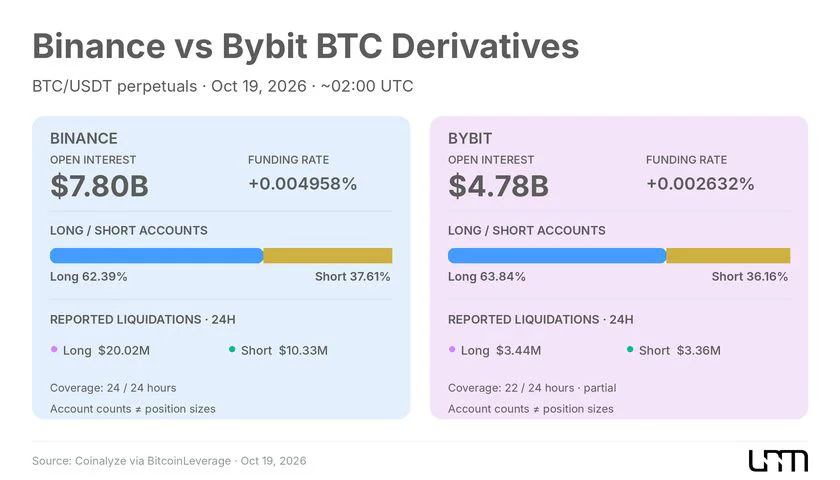
According to BitcoinLeverage, based on Coinalyze data, on the morning of October 19, the open interest for individual perpetual BTC/USDT contracts was:
Binance — about $7.85 billion.
Bybit — about $4.79 billion.
These figures refer only to specific contracts and trading platforms. They cannot be equated with the total open interest across the entire Bitcoin market, which includes numerous exchanges, contracts, and types of collateral.
For analyzing changes in leverage, it is especially important to compare open interest before and after the sell-off. A reduction in the dollar figure does not always mean a proportional closure of contracts, as part of the change may be due to a decrease in Bitcoin's price. Therefore, it is advisable to evaluate open interest dynamics both in dollars and in BTC.
The mass liquidations on October 15 confirm the forced closure of a significant volume of long positions, but they do not allow for an accurate calculation of how much the total open interest decreased over the entire period.
If the market does not quickly start accumulating new leverage after the liquidation wave, the likelihood of a repeat cascade of liquidations may decrease. However, further stability depends on the concentration of positions, available liquidity, and the activity of spot buyers.
Thus, reducing excess leverage eliminates some of the imbalances that amplified the previous decline, but it does not in itself create new demand.
Funding rates do not indicate an obvious market overheating
Another way to assess trader positioning is the funding rate of perpetual futures.
Unlike classical futures with an expiration date, perpetual futures can remain open indefinitely. To prevent the contract prices from deviating too much from the spot price, exchanges use a mechanism of periodic payments between participants with long and short positions.
A positive funding rate usually means that holders of long positions pay those with short positions. With a negative rate, the payment direction reverses. A prolonged increase in funding rates can indicate a growing cost of holding long positions and an increased demand for leverage.
On the morning of October 19, according to BitcoinLeverage, BTC/USDT funding rates were about +0.00496% on Binance and +0.00263% on Bybit for the respective accrual periods.
Both values remained positive. However, to assess the degree of overheating, they need to be compared with historical values, taking into account the specifics of the funding rate calculation on each platform and the dynamics of open interest.
Additional information is provided by the ratio of long to short accounts. According to BitcoinLeverage at 02:00 UTC on October 19, about 62.39% of the accounts considered on Binance were on the long side, and about 63.84% on Bybit.
These figures characterize the number of accounts, not the nominal value of positions. A single large participant may hold a greater volume of contracts than many small traders combined. Therefore, the predominance of long accounts cannot automatically be considered proof of buyer dominance in terms of capital volume.
Overall, positive funding rates and positioning data indicate a sustained interest in long positions. However, the available indicators are insufficient to suggest the formation of a new large-scale overheating.
To confirm a sustainable recovery of Bitcoin, it is important that the price increase is not accompanied by a disproportionate rise in open interest and funding rates. Otherwise, the market may again become overly dependent on borrowed capital.
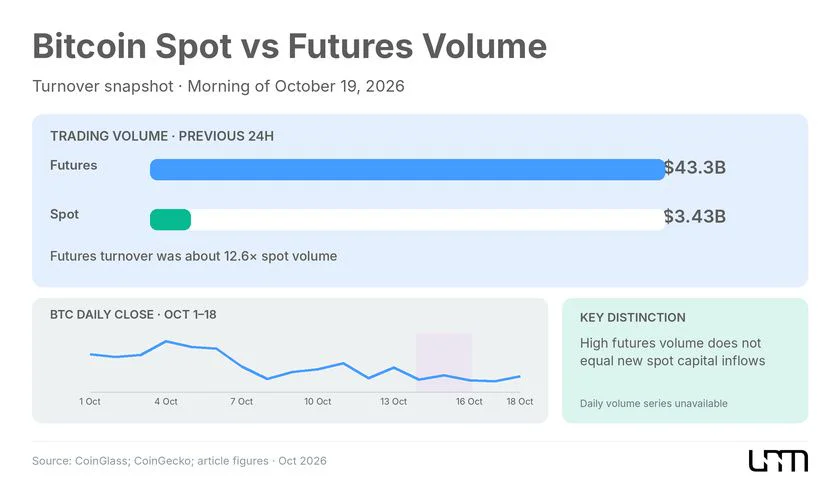
The main question remains on the spot market
To determine how sustainable Bitcoin's recovery is, it is necessary to understand whether the price increase is accompanied by increased buying activity on the spot market.
On the spot market, investors directly buy and sell cryptocurrency. Derivatives allow for price exposure through contracts, often using leverage. These segments are interconnected through arbitrage and hedging, but an increase in futures activity does not necessarily coincide with an equivalent inflow of new capital into BTC.
Therefore, when analyzing trading volumes, it is important to compare not only absolute figures but also their dynamics relative to previous periods.
Bitcoin's futures turnover can historically significantly exceed spot turnover, as derivative contracts are widely used for speculation, hedging, and risk management. Moreover, the same capital can participate multiple times in derivatives trading, increasing turnover without a comparable inflow of new funds.
To assess the quality of the recovery, it is important to monitor whether spot volumes increase simultaneously with the price rise. If the main acceleration occurs in futures while spot activity remains weak, the movement may be more dependent on trader positioning.
The combination of price and open interest is of particular importance.
Market dynamics | Possible interpretation |
|---|---|
Price rises, open interest rises | The volume of open contracts increases. The direction of demand requires further verification |
Price rises, open interest declines | Possible closing of short positions and reduction in total contract volume |
Price falls, open interest rises | Positioning increases amid price decline, which may increase the risk of sharp fluctuations |
Price falls, open interest declines | Participants close positions, including due to liquidations and risk reduction |
None of the combinations provide a definitive answer without analyzing funding rates, trading volumes, and trade directions.
For instance, a price increase accompanied by a decrease in open interest may be associated with a massive closing of short positions — a situation where forced purchases by sellers amplify the upward movement.
However, this does not mean that every such rise is solely explained by the closing of short positions. Some participants may simultaneously open new long positions or purchase Bitcoin on the spot market.
Additional information is provided by the volume of aggressive purchases — transactions where buyers immediately accept available offers from sellers. In the spot market, an increase in the share of such purchases relative to aggressive sales during a rise in overall turnover may indicate strengthening buying pressure.
It is necessary to distinguish between aggressive purchases on the spot market, reflecting transactions with the underlying asset, and similar operations in the futures market, which characterize trading in derivative contracts.
High purchase volume alone is not equivalent to a net capital inflow. For a more comprehensive assessment, it is necessary to consider counter sales, changes in liquidity, and price behavior.
Thus, the significant role of derivatives in Bitcoin trading does not automatically imply that the recovery is unstable. However, without confirmed growth in spot activity, it cannot be confidently stated that the current rebound is supported by new capital.
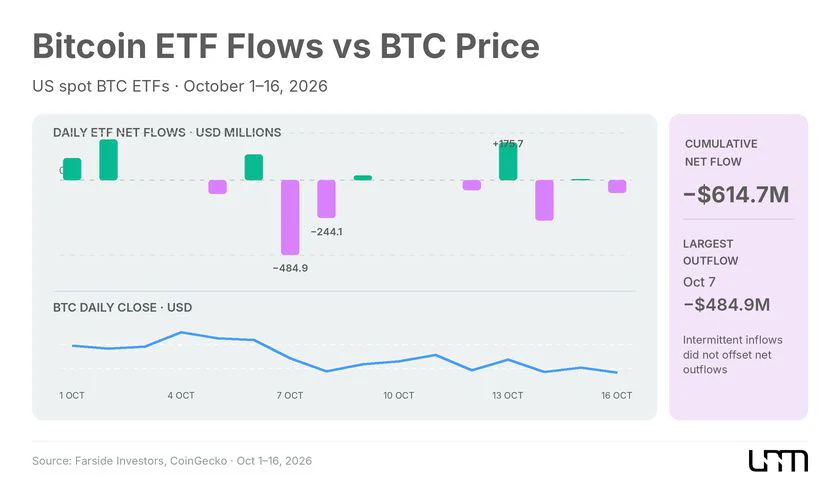
Bitcoin ETFs do not yet confirm a sustainable return of capital
An additional indicator of demand is American spot exchange-traded funds on Bitcoin (ETFs). They allow investors to gain exposure to cryptocurrency through regulated exchange instruments, and net fund flows help assess changes in interest in this market segment.
After September inflows, the situation in October became less favorable. According to statistics from Farside Investors, on October 7, funds recorded a net outflow of $484.9 million, and on October 8, another $244.1 million. More details about this episode were reported by The Unum in the article about October outflows from Bitcoin and Ethereum ETFs.
In the following days, inflows periodically resumed but did not form a sustainable positive trend. For example, on October 13, funds received $175.7 million in net inflows, but on October 14, they recorded an outflow of $261.4 million.
The last completed trading session before October 19, Friday, October 16, brought another $82.4 million in net outflows.
Based on daily statistics from Farside, from October 1 to 16, the cumulative net outflow from American spot Bitcoin ETFs amounted to approximately $614.7 million.
However, ETF flows should not be equated with all institutional or spot demand. Large participants may buy Bitcoin directly, conduct over-the-counter transactions, or form positions through other financial instruments. Additionally, net fund flows reflect changes in capital in a specific segment, not the entire volume of purchases and sales of the underlying asset.
Nevertheless, the absence of sustained inflows through American funds weakens the argument for a broad return of capital. Bitcoin can recover without ETF support, but then it is necessary to seek confirmation of demand in other market segments.
In a broader context, this issue is examined in The Unum's analysis “Who will buy Bitcoin next? The market is looking for a new buyer after ETFs and Strategy”.
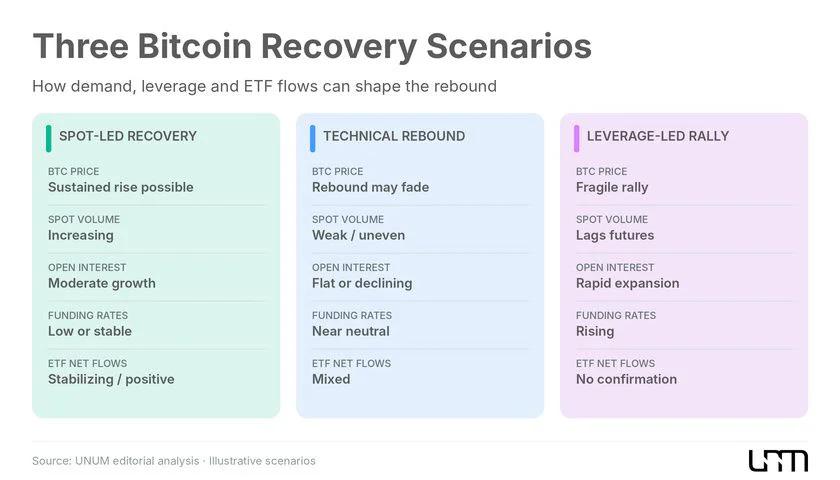
Three scenarios for Bitcoin recovery
After the October sell-off, the reduction of leveraged positions created conditions for market stabilization. However, further dynamics depend on which participants will provide the next wave of purchases.
Three scenarios can be distinguished, differing in sources of demand and the nature of traders' positioning.
Recovery supported by spot buyers
In the first scenario, Bitcoin's growth is accompanied by an increase in spot volumes, improved capital flows into exchange-traded funds, and moderate changes in open interest.
Financing rates remain relatively stable as participants do not seek to massively increase leverage. This structure creates more favorable conditions for a prolonged recovery, although it does not rule out new corrections under the influence of macroeconomic factors or changes in liquidity.
Price recovers primarily technically
After a massive sell-off, the pressure from forced sales is easing. Some participants are closing short positions, while other traders are buying the dip, and Bitcoin is returning to its previous trading range.
Meanwhile, spot volumes are not showing a sustainable acceleration, and capital flows into exchange-traded funds remain unstable. When the effect of short covering fades, additional demand is needed for further price increases.
The market is re-accumulating leverage
In the third scenario, Bitcoin's recovery attracts traders using borrowed funds. Open interest is increasing faster than spot activity, and funding rates are rising as demand for long positions grows.
Initially, this can support the price, but the market becomes more sensitive to a reversal. Even a relatively small decline can trigger forced position closures, and the subsequent cascade of liquidations can amplify the fall.
As of October 19, available indicators do not allow for a definitive determination of the prevailing recovery mechanism. Large-scale liquidations indicate a reduction of previously accumulated positions, and current funding rates themselves do not confirm a new extreme overheating.
However, unstable capital flows into exchange-traded funds and a lack of confirmation of spot demand growth do not yet provide grounds to consider Bitcoin's recovery a full-fledged reversal.
The current situation is more accurately viewed as a stabilization phase following a sharp reduction in risk.
Signals indicating that the recovery is becoming sustainable
In the coming days, investors should focus not so much on individual price levels as on the consistency of spot and futures market indicators.
Four indicators will help assess the quality of further movement.
Spot volumes and market buy balance. A sustainable increase in turnover along with a rise in the share of aggressive buying will be a more convincing sign of returning demand than a temporary acceleration of futures trading.
Aggregate open interest in Bitcoin. A moderate increase in this indicator amid rising prices appears less risky than a sharp expansion of positions without a comparable increase in spot activity. To exclude the effect of contract revaluation, it is important to monitor open interest not only in dollars but also in BTC.
Funding rates and liquidations. Rapidly rising rates along with the accumulation of long positions may signal a new overheating. Additionally, it is necessary to analyze the ratio of long and short position liquidations to determine which side of the market is under the most pressure.
Capital flows into Bitcoin ETFs. The resumption of consistent net inflows will support the hypothesis of returning demand through regulated investment instruments, although it does not guarantee price growth by itself.
These changes should be evaluated over comparable time intervals. A single positive funding rate, one day of inflows into exchange-traded funds, or a temporary spike in volumes can create a false impression of a sustainable reversal.
Currently, the main feature of the market is that Bitcoin is recovering after a massive reduction in leveraged positions, but there is still no sufficient evidence of new capital inflows.
A return to $83,000 is not so much a confirmation of buyer strength as a test of market structure. If the recovery begins to be supported by spot purchases, it will gain a more solid foundation. However, if the main momentum is again formed primarily through borrowed funds, Bitcoin will remain vulnerable to a repeat of the October wave of liquidations.