


BRN
BRN · Barrel
Updated 20:50
109.4 USD
-0.0000011 (0.00%)


Brent Crude Oil is one of the main global price benchmarks for the oil market. Brent refers to an oil benchmark associated with the delivery of several grades of crude oil and is used to determine the cost of a large number of oil contracts and physical deliveries.
In what units is Brent priced
To correctly read oil quotes online, you first need to understand the unit of measurement. On the international market, the price of Brent oil is usually expressed in US dollars per barrel — USD/bbl.
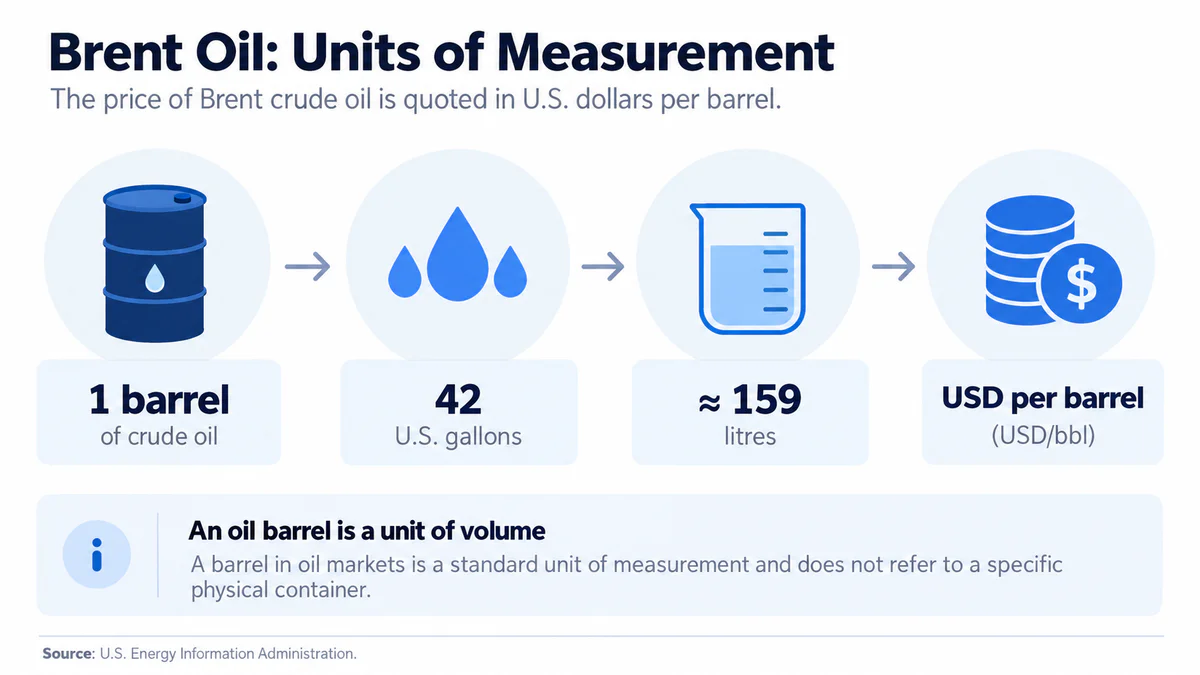
One oil barrel equals 42 US gallons, or approximately 159 liters. In this case, a barrel is a unit of volume, not a designation of a physical metal drum. This standard is used in oil market statistics and exchange trading.
For example, if the price of a barrel of oil is $80, this means that the market quote is $80 for 42 US gallons of crude.
| Unit | Value |
| 1 oil barrel | 42 US gallons |
| 1 oil barrel | ≈ 159 liters |
| Main Brent quote | USD per barrel |
| Exchange designation of a barrel | bbl |
However, converting barrels to tons is more complex. Different grades of oil have different densities, so there is no universal formula of "1 ton = a certain number of barrels" for all oil.
What crude oil is used for
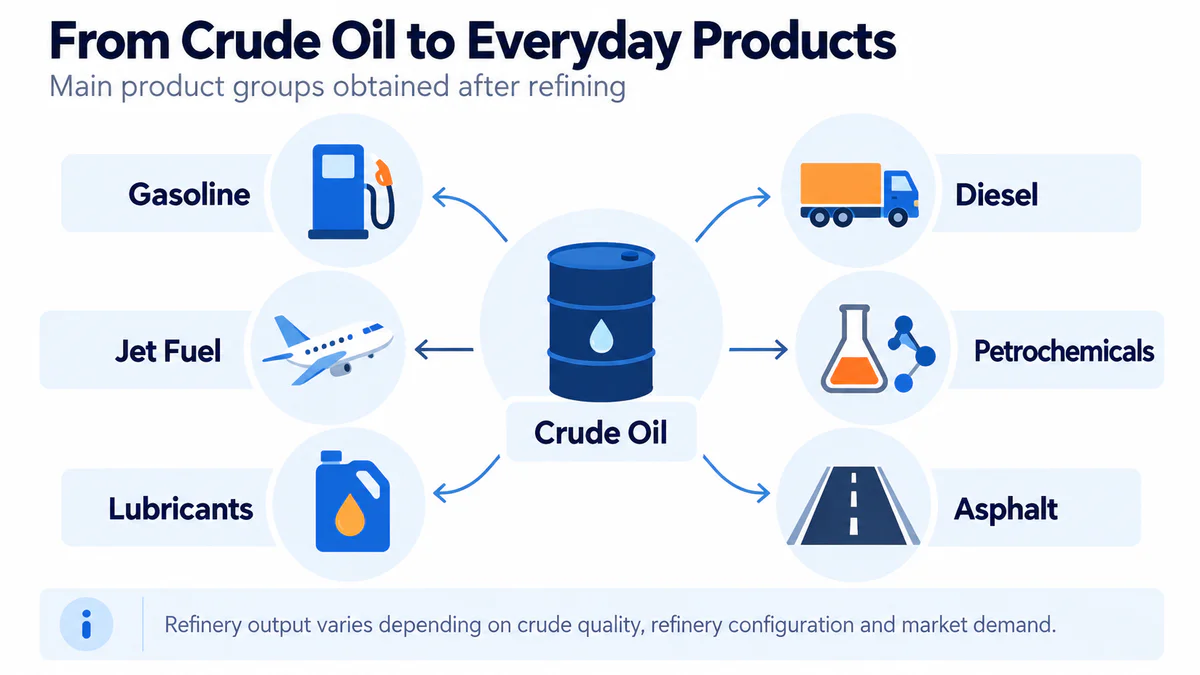
Crude oil is hardly ever used by the end consumer in the form in which it is extracted from the field. Most of the raw material is sent to refineries, where it is processed into fuel, petrochemical components, lubricants, and other products.
It is the demand for refinery products that largely determines the global economy's need for crude oil.
Transportation fuel. After processing, the raw material is turned into: automotive gasoline, diesel fuel, aviation kerosene, and marine fuel components. Therefore, changes in automotive activity, freight transportation, and air traffic can influence the overall demand for oil.
Petrochemical industry. Petroleum products are used in the production of: plastics, synthetic materials, packaging, solvents, chemical components, and some textile and industrial materials. For this reason, the demand for oil is linked to the state of industrial production.
Other petroleum products. Oil is also used to produce bitumen for road construction, lubricants, mineral oils, paraffins, and various types of industrial raw materials.
The composition of products that a refinery obtains from one barrel is not constant. It depends on the characteristics of the oil, the configuration of the plant, and the current demand for specific petroleum products.
How the global oil market is structured
The Brent price does not appear in isolation on the trading screen. Behind it lies a global system of extraction, transportation, storage, processing, and trading of physical raw materials.
Simplified, the path of oil looks like this: field → extraction → transportation → storage → refining → petroleum products market.
Different groups of companies and government institutions participate in this chain.
- Producers extract raw materials from onshore and offshore fields.
- Transport companies move oil through pipelines, by rail, and by sea tankers.
- Trading companies organize deliveries between regions and work with physical and financial contracts.
- Refineries purchase oil to produce fuel and other products.
- Governments regulate extraction, export, taxation, and in some cases manage national oil companies.
- Banks, funds, and traders participate in the futures, options, and other financial instruments market.
Unlike gold, most of the extracted oil is constantly consumed. Therefore, for analyzing Brent oil, the current balance of production and consumption, the volume of spare capacity, stocks, and the ability to quickly move raw materials between regions are especially important.
Where oil is extracted
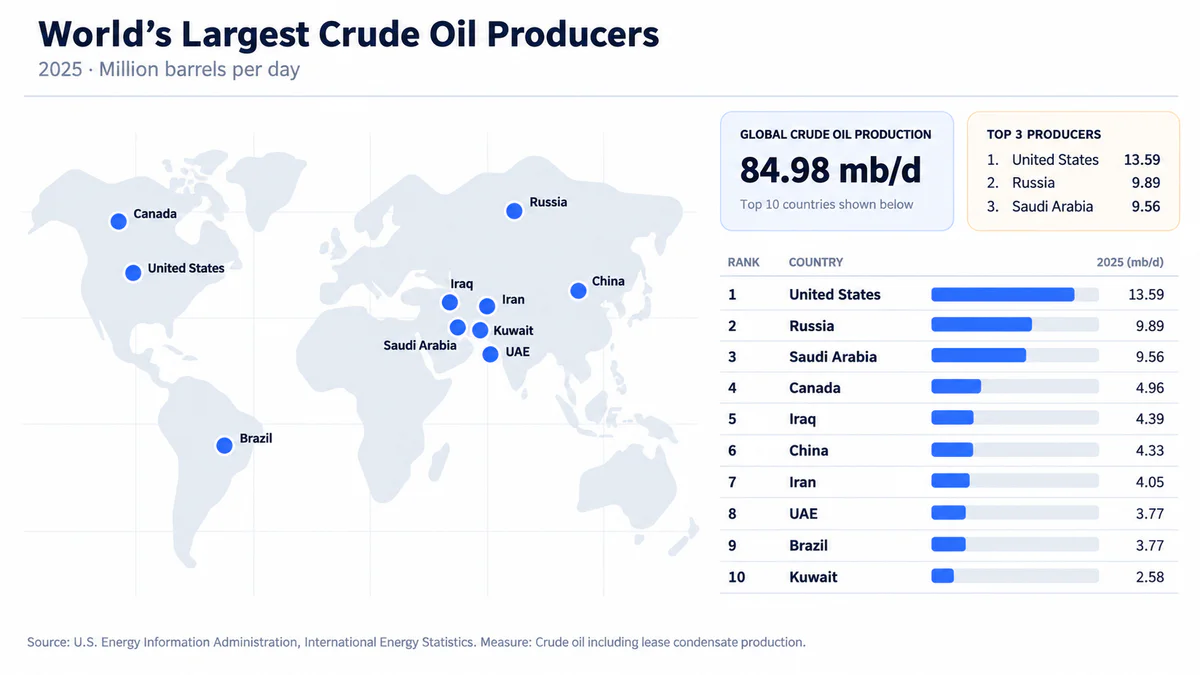
Oil extraction is distributed among several major regions: North America, the Middle East, Eurasia, South America, Africa, and the North Sea. Therefore, a change in production even in one major country can affect the balance of the global oil market.
According to the EIA, in 2025, the largest producer of crude oil, including lease condensate, remained the United States. They were followed by Russia and Saudi Arabia.
A country's position in the ranking itself does not show its influence on the price. Export volumes, domestic consumption, spare production capacity, raw material quality, and the ability to quickly change supplies to the international market also matter.
Why Brent is considered a benchmark oil
There are dozens of grades of oil on the global market with different characteristics and delivery conditions. Establishing a completely independent price for each of them would be inconvenient, so market participants use several main benchmarks.
Brent became one of these benchmarks due to the developed system of physical and financial trading around the North Sea market.
Modern Brent is not just the price of a single oil field. The Dated Brent complex includes assessments of several streams — Brent/Ninian Blend, Forties, Oseberg, Ekofisk, Troll, and WTI Midland. This expands the volume of crude on which the benchmark price can be determined.
The price of a specific crude grade can be determined relative to the benchmark.
Simplified formula: Grade Price = Brent ± Differential
If a grade is in high demand or has more convenient characteristics for processing and delivery, it may trade at a premium. If its quality, logistics, or market balance are less attractive, it may trade at a discount.
The differential constantly changes. Therefore, the same Brent price does not mean the same cost for all crude oil grades.
How Brent oil price is formed
The market value of a barrel of Brent is formed under the influence of both physical and financial markets. Producers and refiners assess the real balance of crude, while derivatives market participants constantly incorporate future expectations into the price.
Therefore, price movement can begin even before actual changes in production or inventories occur.
The main elements of pricing include:
- global demand;
- oil production and export;
- commercial and strategic inventories;
- spare production capacity;
- logistics and transportation costs;
- state of refining;
- futures curve;
- OPEC+ decisions;
- macroeconomic expectations;
- geopolitical risks.
For example, the market may react to an expected supply reduction even before production volumes actually decrease. Similarly, weak economic forecasts can pressure Brent prices if investors anticipate reduced fuel consumption.
Brent spot price
Spot and physical price benchmarks are used to assess the physical oil market. They reflect the cost of crude delivered in relatively short timeframes.
The term "Brent spot price" can be used simplistically. The physical Brent complex has its own assessment methodology, delivery conditions, and differentials between individual grades.
The cost of a specific batch depends on:
- grade and quality of oil;
- delivery date;
- loading location;
- transportation costs;
- availability of tankers;
- regional demand;
- situation at refineries.
Therefore, the price of an actually sold batch of oil may differ from the value seen as the Brent crude oil price on a financial platform.
Brent futures price
Most users who open a Brent oil chart encounter futures market quotes.
Futures are standardized contracts whose value is linked to the price of oil for a specific future period. Brent futures are traded on ICE Futures Europe with a standard contract size of 1,000 barrels. The price is quoted in US dollars and cents per barrel.
At the same time, several contracts with different delivery months exist in the market. For example, the nearest contract, a contract two months out, three months out, six months out, and further. Their prices may differ.
The sequence of these quotes forms the oil futures curve.
Contango and backwardation
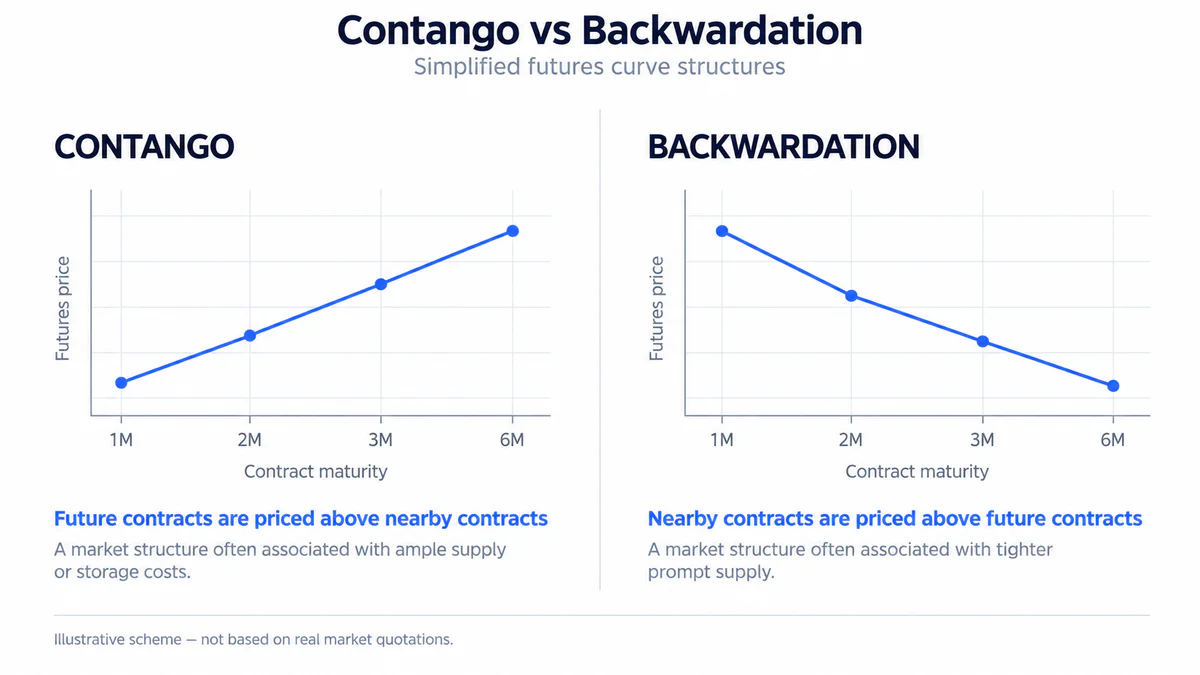
The current Brent oil price shows only part of the picture. To analyze market balance, traders also compare the cost of near-term and longer-term futures. Depending on their relationship, the curve may be in a state of contango or backwardation.
Contango occurs when longer-term futures are more expensive than near-term ones. This structure can arise when there is sufficient oil in the current market, and storing crude involves additional costs.
Contango itself does not mean that the price will necessarily rise. The futures curve shows the current price structure for different terms, not a guaranteed forecast of future spot prices.
Backwardation is the opposite situation: near-term deliveries are more expensive than distant contracts. This structure may appear if market participants highly value the availability of oil here and now.
Factors influencing the curve shape include:
- inventories;
- storage costs;
- current supply deficit or surplus;
- logistical constraints;
- expectations of producers and consumers.
Changes between contango and backwardation can be an important element of oil market analysis. For example, the IEA recorded transitions of oil futures curves between these states during 2026 amid significant changes in physical balance and supplies.
What are Brent crude futures
Brent futures allow for working with changes in oil prices without purchasing and storing physical crude. They are used by oil companies, refiners, trading companies, and financial participants.
The standard ICE Brent Crude Futures contract corresponds to 1,000 barrels. The contract is denominated in US dollars and cents per barrel. ICE describes it as a deliverable contract based on the EFP mechanism with the option for cash settlement.
For market participants, futures serve two main functions.
Hedging. A company can lock in or partially protect the price of a future oil purchase or sale in advance.
Trading. A participant can take a position based on expectations of changes in the contract's value.
However, Brent oil futures require an understanding of expiration, margin requirements, and leverage. The nominal value of one standard contract significantly exceeds the margin amount typically required to open a position.
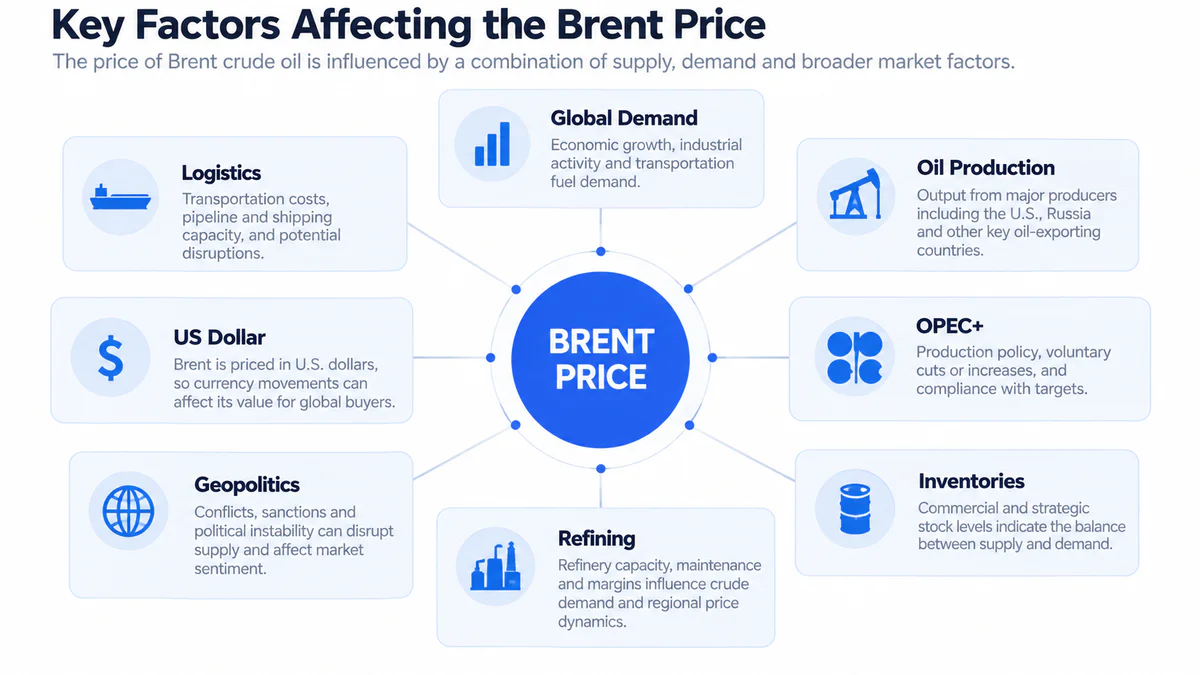
What influences the price of Brent oil
The price of oil constantly reacts to changes in the balance between available supply and the needs of the global economy. The same factor can have different impacts under different conditions.
Therefore, it's better to analyze the oil market not by individual news but by a combination of indicators.
Supply and demand
The oil market is based on the balance between the volume of oil that producers can supply and the amount of raw material that consumers are ready to process and use.
Supply is influenced by production volumes, exports, spare production capacity, technical stoppages, sanction restrictions, pipeline and port availability, accidents, and weather conditions.
Demand is influenced by the state of the global economy, industrial production, automotive transport, air travel, freight transport, the petrochemical industry, and fuel costs.
If demand grows faster than supply, the market can become tighter. If production consistently exceeds consumption, some oil goes into storage, and pressure on the price may increase.
However, this relationship does not work mechanically: market participants usually assess not only current volumes but also the expected balance in the coming months.
OPEC+ decisions
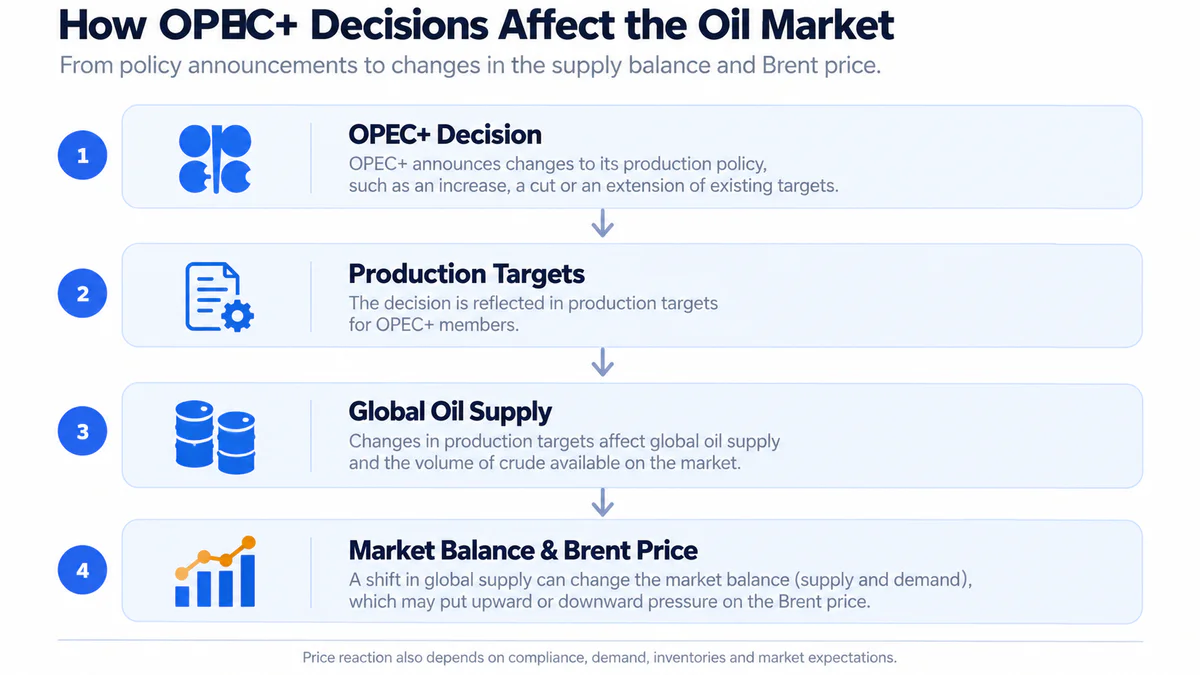
Decisions by OPEC countries and producer states cooperating with the organization under the Declaration of Cooperation—commonly known as OPEC+—are of great importance to the oil market.
The cooperation mechanism was established in 2016. Countries coordinate production policy and periodically review production levels depending on market conditions. The format continues to operate, and monitoring market conditions and production commitments remains part of its work.
Reducing target production levels potentially decreases available supply, while increasing them allows for higher production.
But to evaluate a decision, it's necessary to look deeper:
- how much the quota has changed;
- which countries are involved in the change;
- what their actual production levels are;
- whether the restrictions are being observed;
- how much spare capacity remains;
- whether the market anticipated such a decision in advance.
Therefore, an announcement of production cuts does not guarantee an automatic increase in the Brent price.
Oil production in the USA
The American oil sector plays an important role in global supply. In 2025, the US produced an average of about 13.6 million barrels of crude oil per day, remaining the largest producer in the world. A significant part of the growth in recent years is associated with the development of shale fields and increased production efficiency.
When analyzing the American market, attention is paid to:
- total production volume;
- production in the Permian Basin;
- the number of active drilling rigs;
- productivity of new wells;
- capital expenditures of companies;
- American exports.
The number of drilling rigs is published by Baker Hughes. For instance, the indicator may decrease or increase before changes become noticeable in overall production, although there is no direct correlation between the number of rigs and the short-term price of Brent.
Oil inventories
Inventories indicate what portion of the extracted raw materials and petroleum products have not been consumed by the market temporarily.
Typically, the following are analyzed:
- commercial crude oil inventories;
- gasoline inventories;
- distillate inventories;
- inventories in key oil hubs;
- government strategic reserves.
The market pays special attention to US statistics. The EIA regularly publishes the Weekly Petroleum Status Report, which includes information on inventories, production, imports, and other indicators.
Inventories increase → supply relative to current consumption may be high.
Inventories decrease → consumption and exports may exceed the influx of new volumes.
But interpreting the figure requires context. For example, a decrease in inventories may be seasonal or occur simultaneously with a drop in refinery utilization.
State of the global economy
Oil is used in transportation, industry, and petrochemicals, so demand is linked to economic activity.
To assess the situation, the following are used:
- global GDP forecast;
- PMI indices;
- industrial production;
- international trade;
- freight transportation;
- automobile activity;
- aviation traffic.
A decline in industrial activity can reduce the expected demand for fuel and raw materials. Conversely, an acceleration of the economy can increase consumption.
At the same time, a high oil price itself can restrain demand, as it increases costs for companies and consumers.
Geopolitical Events
The oil market is sensitive to events that can disrupt physical supplies.
These include:
- military conflicts;
- sanctions;
- export restrictions;
- pipeline issues;
- attacks on energy infrastructure;
- port closures;
- shipping restrictions through key maritime routes.
The market often reacts not to the political headline itself, but to the question: will the amount of available oil change?
If supplies continue without significant restrictions, the initial price increase may be short-lived. However, if the event truly reduces exports or production, the impact can be more prolonged.
US Dollar Exchange Rate
Since the price of a barrel of Brent is expressed in dollars, the currency market is also considered in the analysis.
When the dollar strengthens, oil becomes more expensive in conversion for some buyers using other currencies. Conversely, a weakening of the US currency can reduce this effect.
However, the relationship between the dollar and oil is not constant. If the market faces a serious shortage of raw materials, the supply factor can outweigh currency movements.
Seasonal Demand
Consumption of oil products changes throughout the year. It is influenced by the season of car trips, air travel, heating period, agricultural work, and scheduled refinery maintenance.
Therefore, comparing weekly inventories or demand only with the previous week is insufficient. It is useful to consider indicators for the same period in previous years and seasonal averages.
Refining Capacity
The availability of oil does not necessarily mean the availability of fuel. Between extraction and the end consumer are refineries.
For analysis, factors such as refinery utilization, processing volume, scheduled maintenance, emergency shutdowns, refining margins, and the state of oil product inventories are used.
The IEA includes processing, inventory, supply, and demand indicators in its regular Oil Market Report, allowing the oil market to be viewed as a single system, not just focusing on production.
How to Trade Brent Oil
For a private investor, investing in oil usually does not mean buying physical barrels. Storing and transporting crude oil requires specialized infrastructure, so market dynamics are accessed through financial instruments.
Each of these instruments is differently linked to the price of Brent oil, so the same market movement does not guarantee the same financial result.
Brent futures provide the most direct access to the exchange price of the corresponding contract.
The standard ICE Brent Crude Futures contract corresponds to 1,000 barrels. Therefore, even a small change in the quotation can significantly alter the monetary value of the position.
Futures trading requires consideration of contract size, margin requirements, expiration, leverage, volatility, and the rules of the specific broker and exchange.
Due to the margin nature of the instrument, trading Brent oil through futures can lead to both quick profits and significant losses.
ETFs and ETCs on oil. Exchange-traded products allow access to the oil market without directly trading standard futures. However, there is an important distinction from physically backed funds for some precious metals: the oil product often uses futures contracts.
When the nearest contract is nearing expiration, the fund may sell it and buy the next one. This process is called rollover.
The result depends on the market structure:
- in contango, the new contract may cost more than the old one;
- in backwardation, it may cost less.
Therefore, an oil ETF or ETC over a long period may show a result that significantly differs from the change in the nearest Brent quotation.
CFDs allow obtaining a financial result from changes in the value of the underlying instrument without owning physical oil or a standard exchange-traded future.
The features of CFDs depend on the specific broker, but usually, it is necessary to consider:
- spread;
- cost of carrying the position;
- leverage used;
- quotation formation mechanism;
- risk of forced position closure.
Therefore, before using the instrument, it is important to understand which specific contract or index underlies the displayed price.
Oil company stocks. Another way to gain indirect access to the oil sector is through the stocks of companies involved in the extraction, refining, or transportation of oil.
However, an oil company's stock is not a substitute for oil itself. The business's value is influenced by production volume, cost of production, oil selling price, capital expenditures, debt, taxes, dividend policy, quality of deposits, geography of operations, and management efficiency.
Therefore, an oil company's stock prices may decline even when Brent rises, or conversely, rise faster than the oil itself.
Main risks of trading Brent oil
Oil is considered a volatile commodity asset. Its price can change significantly in a short time, especially if the market faces unexpected changes in supply or economic expectations. Before using oil instruments, it is important to consider not only potential returns but also several distinct types of risk.
- Market volatility – Brent prices today can be simultaneously influenced by economic statistics, inventory data, producer statements, geopolitical news, and changes in market participant positions. A combination of several factors can lead to sharp movements.
- Leverage risk – Futures and CFDs allow you to control a position whose nominal value can significantly exceed the funds invested. This increases the sensitivity of capital to small price changes.
- Rollover risk – When using futures or funds based on them for the long term, it is necessary to regularly transition from an expiring contract to the next one. In conditions of persistent contango, such operations can worsen the result relative to a simple change in Brent oil prices.
- Currency risk – Oil is quoted in US dollars. For an investor with a different base currency, the final result may depend simultaneously on changes in Brent and the dollar exchange rate.
- Geopolitical risk – Oil infrastructure and international supplies are geographically distributed across different regions. Conflicts, sanctions, and shipping restrictions can affect both the physical volumes of supply and market expectations.
- Risks of oil companies – Producers' stocks additionally carry corporate risks: accidents, cost increases, unsuccessful projects, debt burden, tax changes, regulation, management quality. Therefore, investing in an oil company and holding a position directly in Brent have different risk profiles.
Brent as an indicator of the global economy
The price of oil is monitored not only by commodity market participants. Energy carriers are part of the cost of transportation, production, and international trade, so significant price changes can spread to other parts of the economy.
An increase in oil prices can raise:
- fuel costs;
- transportation expenses;
- airline costs;
- industrial expenses;
- the cost of producing some goods.
This can create additional inflationary pressure.
For exporting countries, a higher oil price, all else being equal, can increase export revenues. For major importers, the effect can be the opposite — expenses for purchasing energy resources rise.
However, Brent cannot be used as an unequivocal indicator of the state of the global economy.
The price can rise due to strong demand or a reduction in supply. In the first case, the reason may be increased economic activity, and in the second — disruptions in production or logistics.
Therefore, changes in Brent crude oil need to be analyzed alongside economic and physical market indicators.
About commodities
Stay updated on the current price of Brent oil, explore quotes and the price dynamics of a barrel on the online chart. Learn about the factors influencing Brent's price, how the global oil market operates, and what to consider when analyzing and trading.