


CL
CL · Barrel
Updated 20:49
99.81 USD
+0.000002 (0.00%)


WTI (West Texas Intermediate) Oil is one of the key price benchmarks of the American oil market. Its quotes are used by producers, refining companies, traders, and investors to assess the cost of raw materials and manage price risks.
The price of WTI oil is measured in US dollars per barrel and is closely tied to futures trading on the NYMEX exchange. The dynamics of the American benchmark are particularly influenced by US production volumes, commercial inventories, refinery utilization, and oil transportation capabilities.
What is WTI Oil and Where is it Produced
West Texas Intermediate refers to light sweet crude oil, known for its relatively low density and sulfur content, making it suitable for producing gasoline, diesel fuel, and other petroleum products.
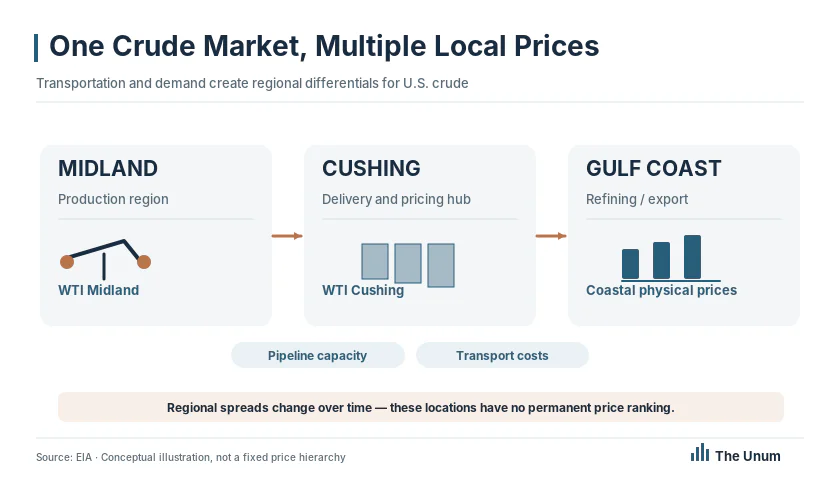
Historically, WTI has been associated with oil production in Texas, but the modern price benchmark covers a broader market of American oil flows. The supply system linked to WTI receives raw materials from various US production regions, including the Permian Basin.
It is important to distinguish between WTI oil as a physical oil stream and the eponymous exchange benchmark. Futures contracts reflect the cost of oil that meets the quality and delivery conditions set by the exchange.
The central element of this system is Cushing, Oklahoma, where pipelines converge and large storage facilities are located. This is where physical delivery under standard WTI futures is provided.
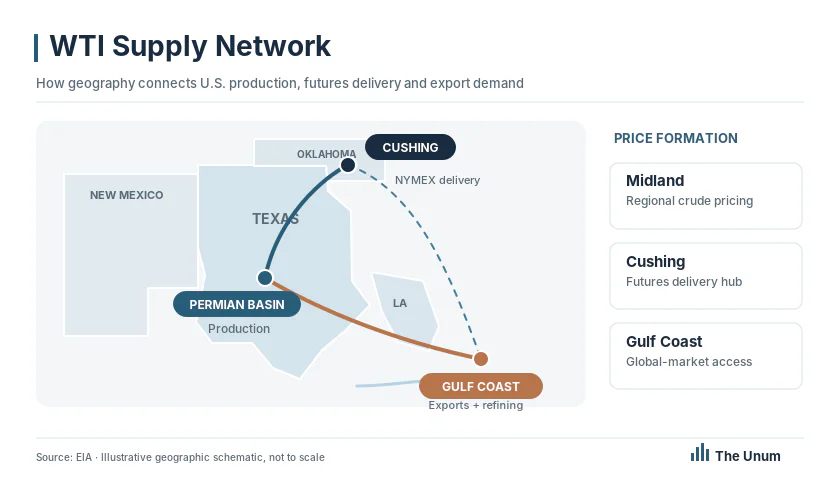
How WTI Oil Price is Formed on NYMEX
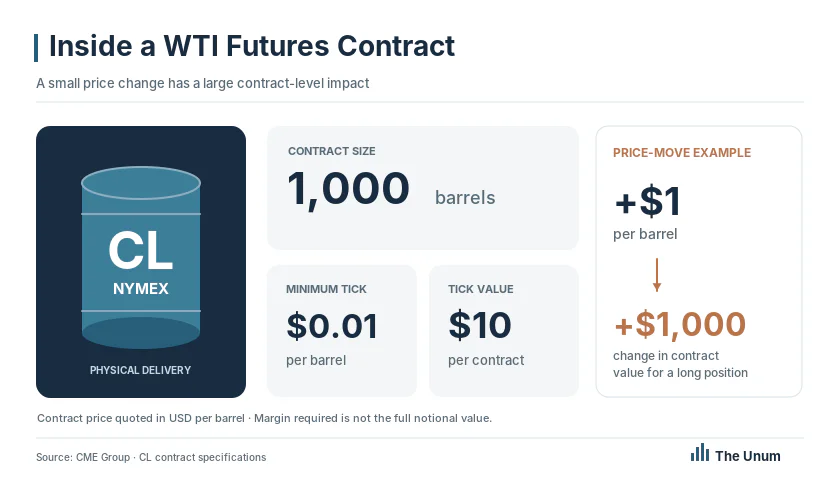
The primary exchange instrument for determining the cost of WTI is the Light Sweet Crude Oil futures on NYMEX, part of CME Group. The standard contract has the ticker CL and provides for the delivery of 1,000 barrels of oil.
The cost of the futures is quoted in dollars per barrel, and each contract relates to a specific delivery month. Therefore, the price of WTI at any given moment depends not only on the state of the physical market but also on the delivery term considered by market participants.
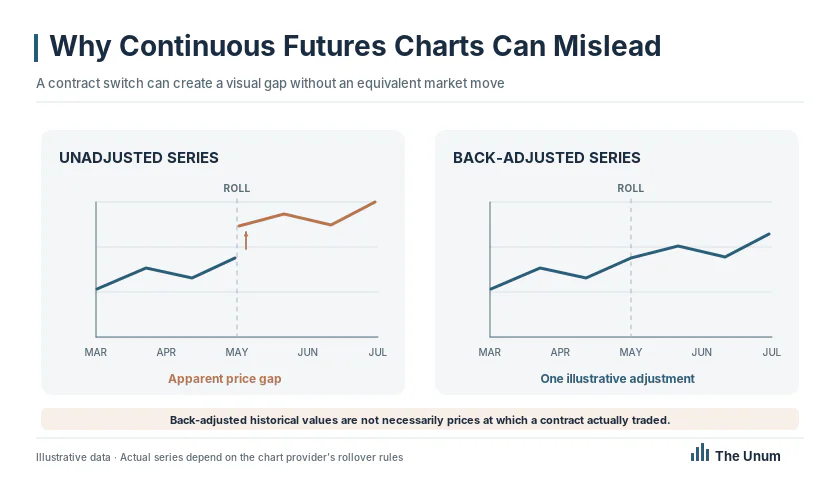
The nearest actively traded contract usually serves as the basis for displaying current futures quotes. As its expiration approaches, market participants transition to the next contract, and financial data providers update continuous price series according to their methodology.
Due to this feature, the long-term chart of WTI oil may contain changes related not only to market movements but also to the change of the underlying contract.
Additionally, it is necessary to distinguish between the exchange quotes CL and the spot price of WTI in Cushing. The former reflects the cost of the futures contract, while the latter is an assessment of the physical oil on the corresponding market.
Why Cushing Affects the Cost of American Oil
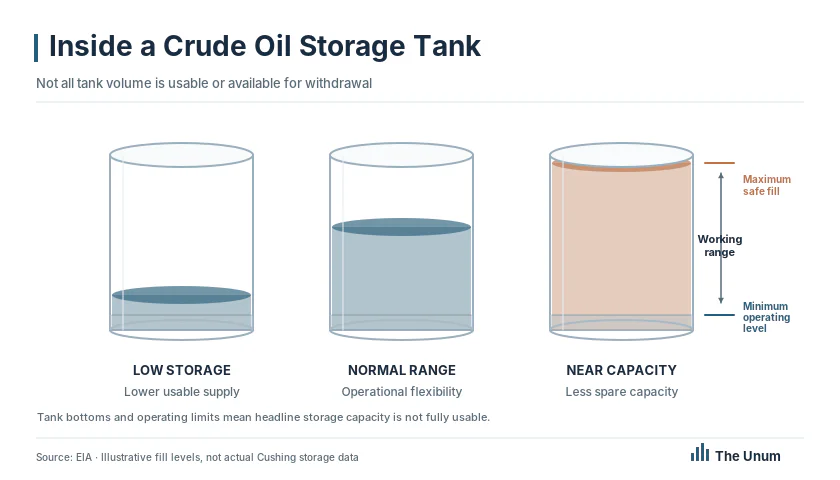
Cushing is one of the most important oil logistics hubs in the US. Through the pipelines located here, raw materials are received from production regions and distributed among storage facilities, refineries, and other transportation points.
Since Cushing is the delivery point for NYMEX WTI futures, the state of the local infrastructure is directly related to the pricing of nearby contracts.
If oil inventories decrease, it may become more challenging for market participants to ensure timely physical delivery. All else being equal, this provides additional support to short-term prices.
When storage facilities fill up quickly and the ability to export raw materials is limited, there may be pressure on oil prices in the region. This situation becomes particularly sensitive with weak demand from refiners.
However, the absolute volume of oil in storage does not always provide a complete picture of the availability of raw materials. It is necessary to consider technological constraints, minimum necessary reserves, and the actual ability to move oil between infrastructure facilities.
How US Oil Production Affects WTI
One of the most important factors in the cost of WTI remains the dynamics of US oil production. In recent decades, its structure has changed significantly due to the development of horizontal drilling and hydraulic fracturing technologies.
The Permian Basin, covering areas of Texas and New Mexico, is of particular importance. It is one of the largest centers of American oil production and plays a crucial role in forming the supply of light crude.
An increase in production can increase the volume of oil available to refiners and exporters, putting pressure on regional prices. However, the impact on WTI depends on how quickly raw materials are transported from production sites to consumers.
If production grows faster than pipeline capacity, price differences between regions in the US may increase. With the expansion of transportation infrastructure, this imbalance can decrease.
Therefore, when analyzing WTI quotes, it is important to consider not only the overall oil production in the US but also its distribution among regions, transportation capabilities, and the cost of raw material delivery.
What EIA Data Helps Analyze the WTI Price
The U.S. Energy Information Administration (EIA) regularly publishes statistics that allow for the assessment of the state of the American oil market.
One of the main sources is the weekly report Weekly Petroleum Status Report. It contains information on crude oil stocks, petroleum products, imports, exports, production, and the operation of refineries.
For analyzing WTI, changes in commercial oil stocks excluding the U.S. Strategic Petroleum Reserve, as well as specific Cushing indicators, are particularly important.
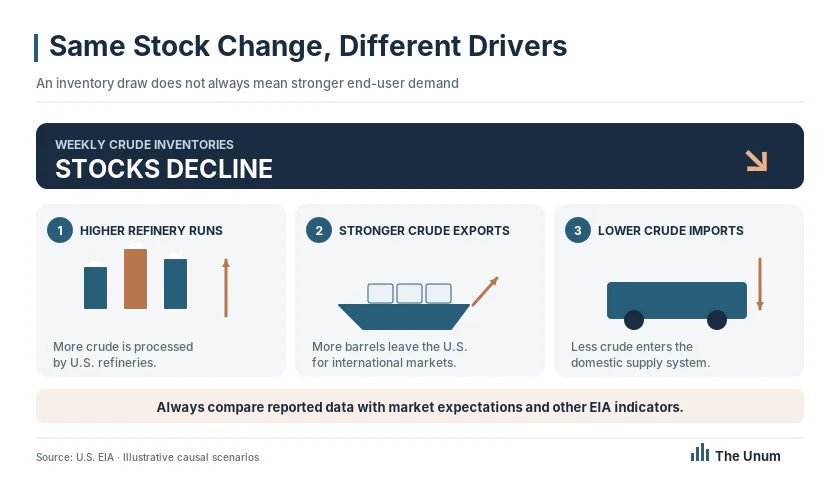
An unexpected reduction in stocks may signal an increase in demand relative to supply. However, a decrease in stocks alone does not guarantee a rise in prices: the reasons for the change and market participants' expectations are important.
For example, active export growth can reduce domestic stocks even with stable demand from U.S. refiners. At the same time, a temporary shutdown of refining capacities can lead to the accumulation of crude without significant changes in production.
Therefore, EIA reports should be analyzed comprehensively, comparing stocks with processing volumes, imports, exports, and petroleum product production.
How Exports and Refining Affect WTI Prices
American oil participates in international trade, so its cost depends not only on domestic consumption but also on the export capabilities of the U.S.
The Gulf Coast plays a key role, where major refineries and export terminals are located. Through this region, American crude reaches foreign markets, including Europe and Asia.
When international demand for American oil increases, exports can support domestic prices. However, the final cost of deliveries depends on transportation costs, tanker availability, and the difference between American and foreign oil prices.
Domestic demand is primarily formed by refineries. Their utilization changes depending on the demand for gasoline, diesel fuel, seasonal maintenance work, and refining profitability.
Therefore, an increase in fuel consumption does not always immediately lead to a rise in WTI. It is important to consider the state of refining capacities and how quickly additional demand for petroleum products translates into crude oil purchases.
How WTI Differs from Brent
WTI and Brent are leading oil benchmarks, but they are associated with different pricing mechanisms. WTI primarily reflects the conditions of the American market with the delivery of a standard exchange contract in Cushing, while Brent is used as an international benchmark closely linked to oil trading in the Atlantic Basin.
The difference between their prices, known as the Brent–WTI spread, helps assess the relative cost of American oil compared to the international benchmark.
The size of the spread depends on transportation costs, the state of American oil infrastructure, export demand, and the availability of alternative oil grades. For accurate comparison, it is necessary to use comparable delivery terms and the same type of price data.
How to Read the WTI Oil Chart
The WTI chart allows tracking changes in the cost of American oil over various periods. Short-term intervals help assess market reactions to statistical releases and economic events, while longer periods reveal sustainable changes in price trends.
When working with the chart, it is necessary to pay attention to the type of quote displayed. If a continuous NYMEX futures series is used, its values depend on the rules for transitioning between contracts.
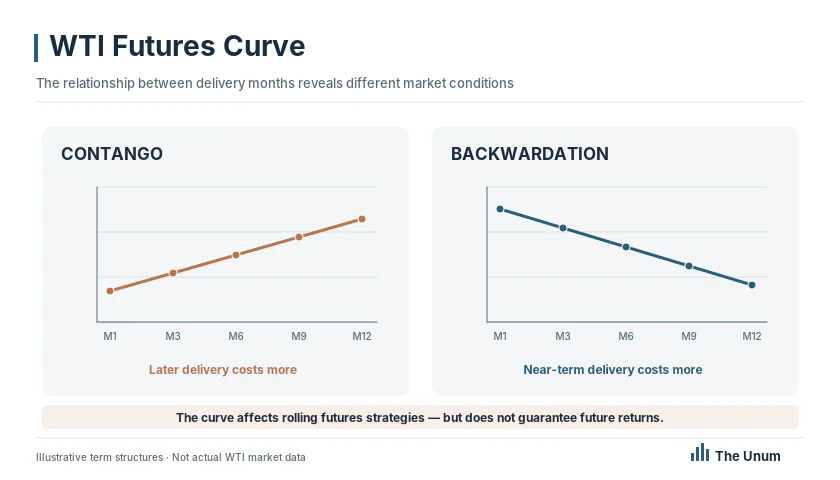
Additional information is provided by the futures curve, showing the cost of oil with different delivery months.
When nearby contracts are cheaper than distant ones, the market is in a state of contango. This structure can reflect storage costs, stock financing, and future demand expectations.
The opposite situation is called backwardation. It occurs when nearby futures are more expensive than later ones, often indicating the increased value of physical oil in the current period.
For WTI, the structure of the curve is especially important due to the physical delivery mechanism of contracts and the dependence of nearby deliveries on the availability of oil in Cushing.
What Risks Are Associated with WTI Futures
Trading WTI futures has features that distinguish this instrument from ordinary ownership of financial assets.
Standard CL contracts provide for physical delivery, so traders need to consider the terms of their circulation, broker requirements, and conditions for closing positions before execution. Additionally, the use of margin increases financial risk.
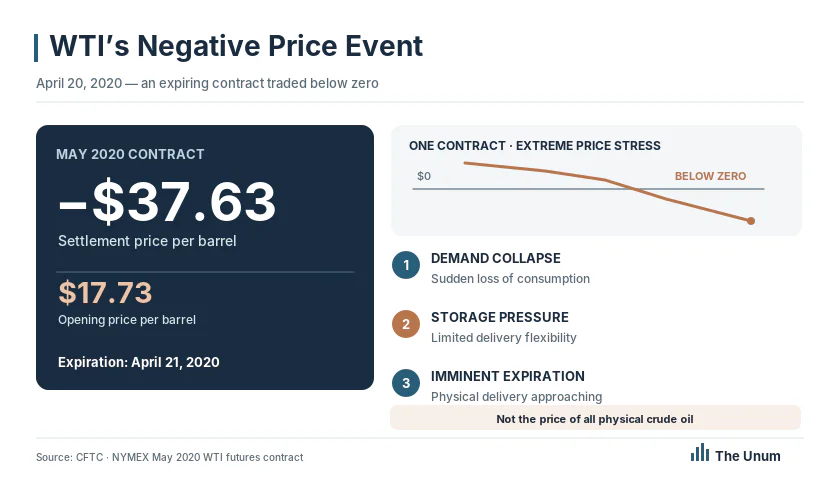
A notable example was April 2020, when the May WTI futures contract closed with a negative price for the first time. On April 20, the contract settled at minus $37.63 per barrel amid a sharp drop in demand, an oversupply of oil, and limited storage capacity ahead of expiration.
This event demonstrated that the value of the nearest futures contract can depend not only on the long-term prospects of the oil market but also on specific physical delivery conditions.
For investors using WTI-based instruments, the costs of rolling over positions between contracts are also important. This is why the returns of oil exchange-traded funds based on futures may differ from changes in the spot price of American oil.
Key Indicators to Monitor for WTI Dynamics
To analyze the American oil market, it is necessary to compare current quotes with production and logistics data.
Particularly important are U.S. oil production volumes, commercial stocks in Cushing, refinery capacity utilization, export flows, and the state of transportation infrastructure.
Additionally, it is worth considering OPEC+ decisions, global demand, U.S. dollar dynamics, and changes in interest rates. These factors influence WTI through the international supply balance, economic expectations, and the competitiveness of American crude.
However, no single indicator can reliably predict the future price of oil. The most informative assessment comes from a combined analysis of fundamental data, the structure of the futures market, and changes in physical oil flows.
About commodities
WTI is a key price benchmark for the American oil market. We explain how quotes are formed on NYMEX, why inventories in Cushing affect the price of a barrel, and what to consider when analyzing the WTI chart.