


NG
NG · MMBtu
Updated 08:50
3.039 USD
-0.0000000304 (0.00%)


Henry Hub Natural Gas is one of the main benchmarks of the American energy market. Henry Hub quotes are most often used when discussing the price of natural gas in the U.S., and futures associated with this benchmark are among the most actively traded energy contracts.
However, Henry Hub is not a type of gas or a conventional name for a trading instrument. It is a real gas hub in Louisiana through which several pipeline systems pass. Due to its location, developed infrastructure, and large number of market participants, its price has become a basic benchmark for trading natural gas in the U.S. Henry Hub is also the physical delivery point for Natural Gas futures on NYMEX.
On this page, you can track the Henry Hub price today, study the natural gas chart, and the dynamics of quotes. However, one price is not enough to understand the market. Gas prices are simultaneously influenced by production, weather, storage, power plant demand, LNG exports, and the state of pipeline infrastructure.
Henry Hub Natural Gas Price Today
The Henry Hub quote shows the wholesale cost of natural gas at one of the key physical nodes in the U.S. The price is usually expressed in U.S. dollars per million British thermal units — USD/MMBtu.
When it is said that the Henry Hub price is, for example, $4/MMBtu, it refers not to the cost of a specific volume of gas but to the cost of the energy contained in it. This approach allows for standardized trading, as the energy value of the same physical volume of gas can vary slightly depending on its composition.
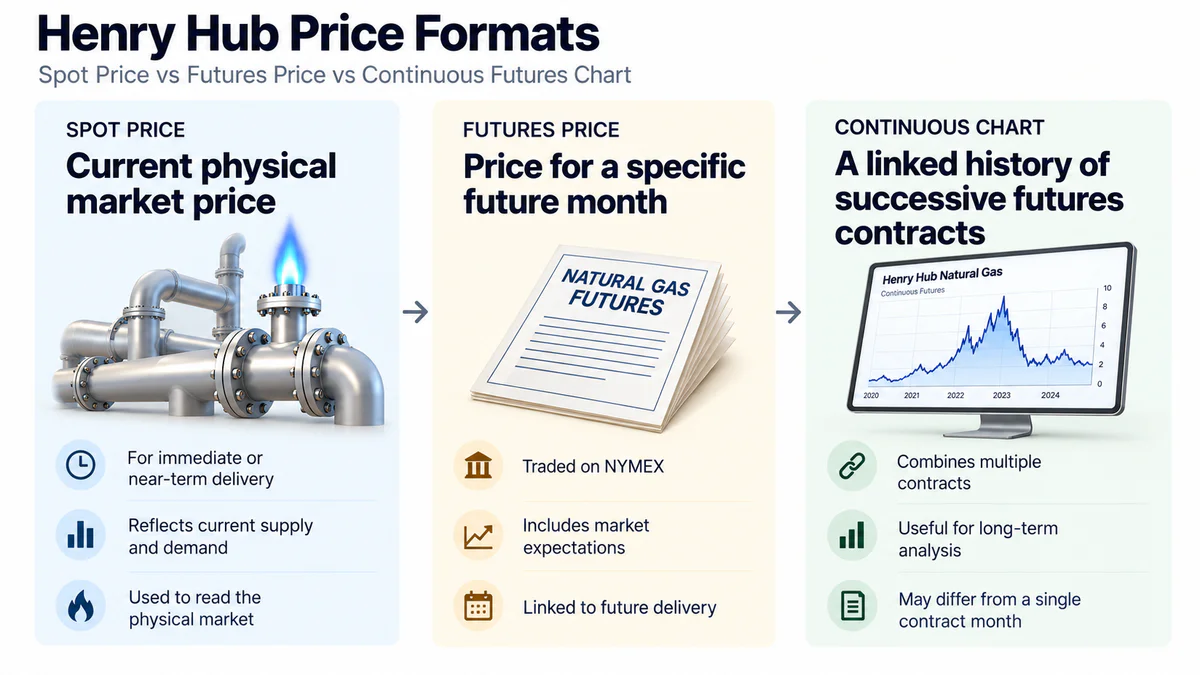
It is also important to understand what exactly the chart shows:
- Henry Hub spot price refers to the physical market and short-term deliveries;
- natural gas futures show the price of a contract for a specific future month;
- continuous futures chart combines data from several consecutive futures contracts and is used for analyzing long-term dynamics.
The price of the nearest future may differ from the spot price, as the market already considers expectations for future weather, storage, production, and demand.
The history of Henry Hub clearly shows how much the American gas market can change. According to the EIA, the average spot price in 2024 was $2.22/MMBtu, while in 2025 it rose to $3.52/MMBtu. During 2025 itself, the daily price moved within a wide range. Therefore, the current cost of gas is better considered alongside the state of the market rather than as an independent indicator.
Other units are also used in statistics:
- cubic feet — cubic feet;
- Bcf — billion cubic feet;
- bcm — billion cubic meters;
- MMBtu — million British thermal units.
Direct conversion of MMBtu to cubic meters requires knowledge of the specific gas's calorific value. The same physical volume can contain slightly different amounts of energy, so a universal ratio for all deliveries would be inaccurate.
Henry Hub Natural Gas Chart and Quotes
The Henry Hub chart allows you to see how the cost of natural gas has changed over time, compare periods of high and low volatility, and assess the market's reaction to changes in fundamental conditions.
Depending on the platform, the chart may show the spot price, the nearest Natural Gas Futures, or a continuous series formed from several consecutive contracts. This distinction matters: a specific future exists only until its expiration date, so trading platforms connect different contracts to build a multi-year trading history.
When analyzing the chart, it is useful to pay attention not only to the price direction but also to:
- daily highs and lows;
- quote changes over the selected period;
- trading volume, if available;
- transition between futures contracts;
- price reaction to storage data, weather forecasts, and demand changes.
It is important not to confuse Henry Hub with the retail cost of gas for households or businesses. The final price includes transportation, distribution, local tariffs, taxes, and other expenses. Therefore, the movement of the Henry Hub quote does not translate directly to consumer bills.
What is Henry Hub
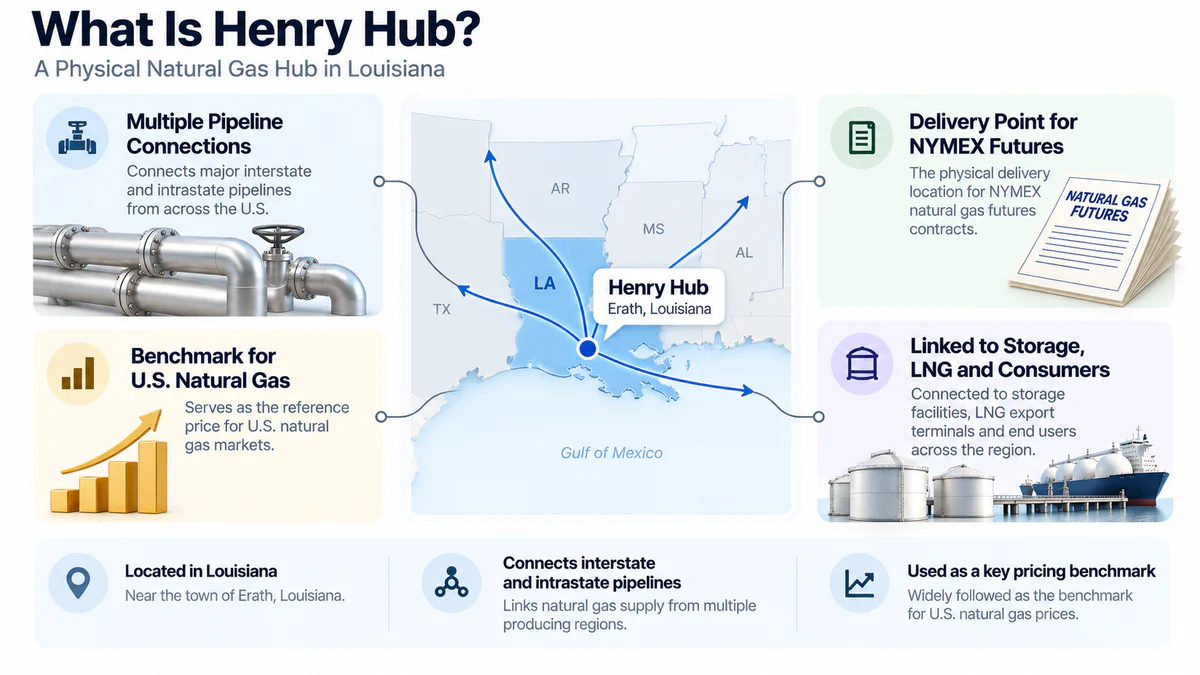
Henry Hub is located near the town of Erath in Louisiana. It is a physical complex of pipelines and associated infrastructure that connects several interstate and intrastate gas transportation systems.
This location allows gas to be directed to different regions of the U.S. and makes the hub a convenient point for physical trading and price formation. A developed network of connections, proximity to production regions, storage facilities, and major consumers gradually made Henry Hub the main gas benchmark in the country.
Other American gas hubs may trade at a premium or discount relative to Henry Hub. The reasons for differences are usually related to the local balance:
- production volume in the region;
- demand from local consumers;
- availability of pipelines;
- infrastructure capacity;
- ability to direct gas to other markets.
For example, in a region with high production and insufficient pipeline capacity, a gas surplus may occur. In that case, the local price can drop significantly below Henry Hub.
Therefore, the expression "natural gas price in the US" somewhat simplifies the real situation. Henry Hub serves as a national benchmark, but the physical cost of gas can vary significantly between regions.
Henry Hub Spot Price for Natural Gas
It shows the cost of natural gas on the physical market for the nearest delivery in the Henry Hub area in Louisiana. According to the EIA definition, the natural gas spot market covers transactions with immediate or short-term delivery, usually for a period of up to 30 days.
The quote reflects the current balance of the physical market: how much gas is available for delivery and how high the demand for it is at the moment.
The spot price can change significantly even within a single year. In 2025, the average Henry Hub spot price was $3.52/MMBtu, while daily values ranged approximately from $2.65 to $9.86/MMBtu. Such volatility reflects the high sensitivity of the natural gas market to seasonality and short-term changes in supply and demand.
Therefore, when analyzing the Henry Hub spot price, it is useful to consider it alongside gas inventories, temperature forecasts, current production, and LNG exports. A high or low quote alone does not show how well the market is supplied with gas and in which direction the balance may change further.
Henry Hub Natural Gas Futures
Henry Hub Natural Gas Futures are traded on NYMEX, part of the CME Group. The exchange code for the standard contract is NG. One contract corresponds to 10,000 MMBtu, and its settlement implies the physical delivery of gas at Henry Hub if the position remains open until the relevant stage of execution.
Futures are used by different market participants. Producers can partially lock in future selling prices, industrial consumers can reduce the risk of rising purchase costs, and traders can open positions based on price movement expectations.
The standard contract is quite large. A price change of just $0.10/MMBtu corresponds to a change in its nominal value of $1,000. Therefore, when trading, it is necessary to consider the position size, margin requirements, leverage, and the likelihood of rapid price movements.
Natural Gas Futures Curve
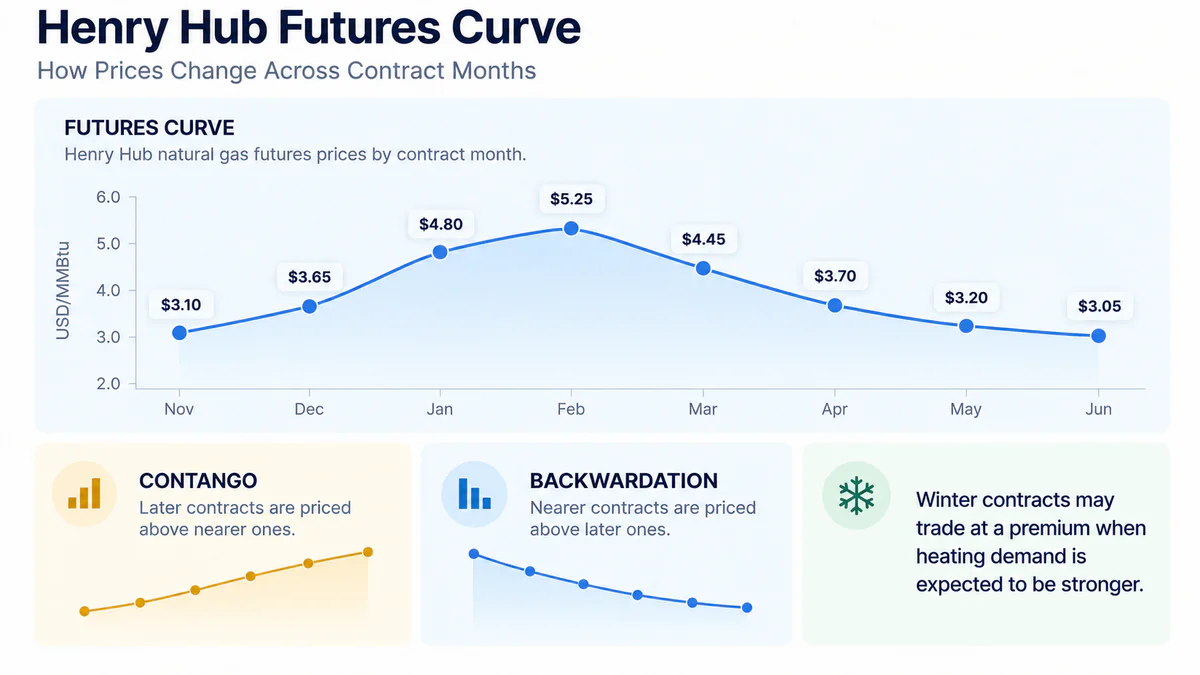
A single Henry Hub quote is not enough to understand market expectations for several months ahead. For this, a futures curve is used—a sequence of contract prices with different expiration dates.
If more distant contracts are priced higher than nearby ones, this structure is called contango. It can occur when there is enough current gas, and future periods are priced higher by the market.
The reverse situation is called backwardation. In this case, nearby contracts are priced higher than distant ones. Such a structure can appear if gas is especially in demand at the moment, for example, due to cold weather, rapid inventory drawdowns, or temporary supply issues.
Seasonality is especially important for natural gas. Winter contracts may include a premium for potentially high heating demand, while spring months often coincide with the period of inventory replenishment. Therefore, the Henry Hub curve often has a more complex shape than a simple upward or downward movement.
The shape of the curve is also important for investors using futures-based products: rolling from an expiring contract to the next can affect the financial result regardless of the overall price direction.
What Determines the Henry Hub Natural Gas Price
The price of natural gas is formed through the balance of supply and demand. However, both sides of this balance can change significantly even within a few days.
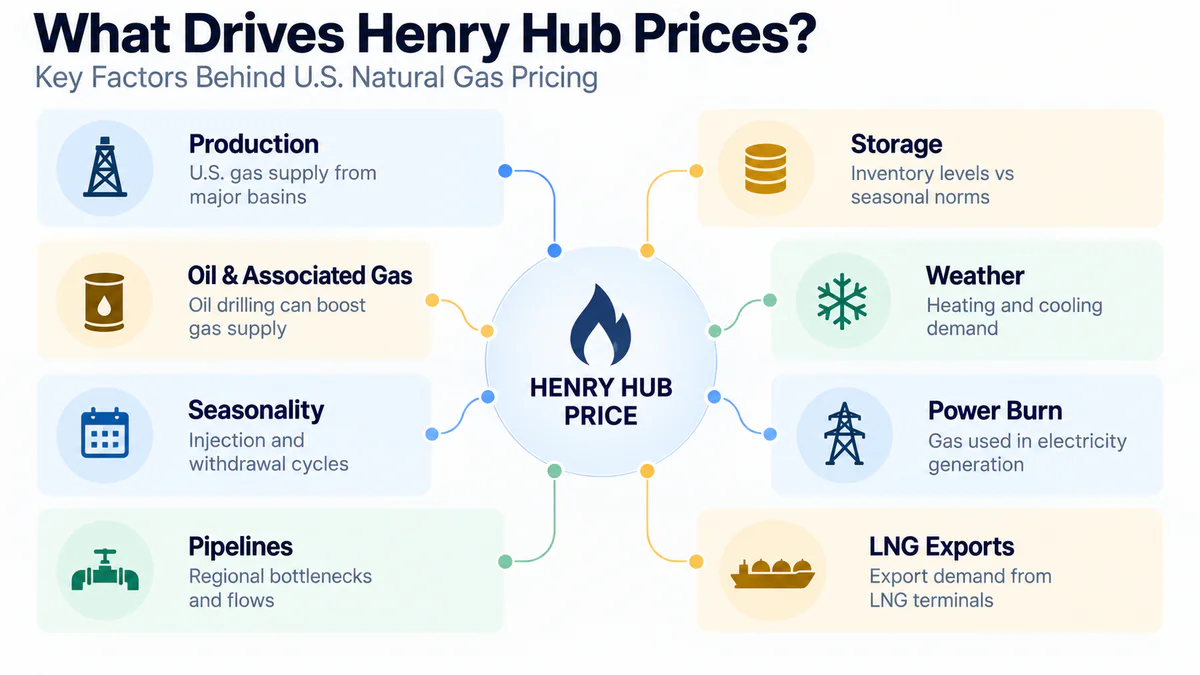
The main factors include:
- natural gas production in the US;
- volume of gas in underground storage;
- air temperature and weather forecasts;
- demand from power plants;
- LNG exports;
- pipeline capacity;
- seasonality;
- oil production and volume of associated gas.
Therefore, the question "why is natural gas rising" rarely has a single answer. For example, a cold forecast may coincide with low inventories and reduced production. In another situation, similar temperatures may have less impact if storage is well-filled and production remains high.
Natural Gas Production in the US
The United States remains the largest producer of natural gas. Significant growth in American production over the past decades is associated with the development of shale fields, horizontal drilling, and hydraulic fracturing.
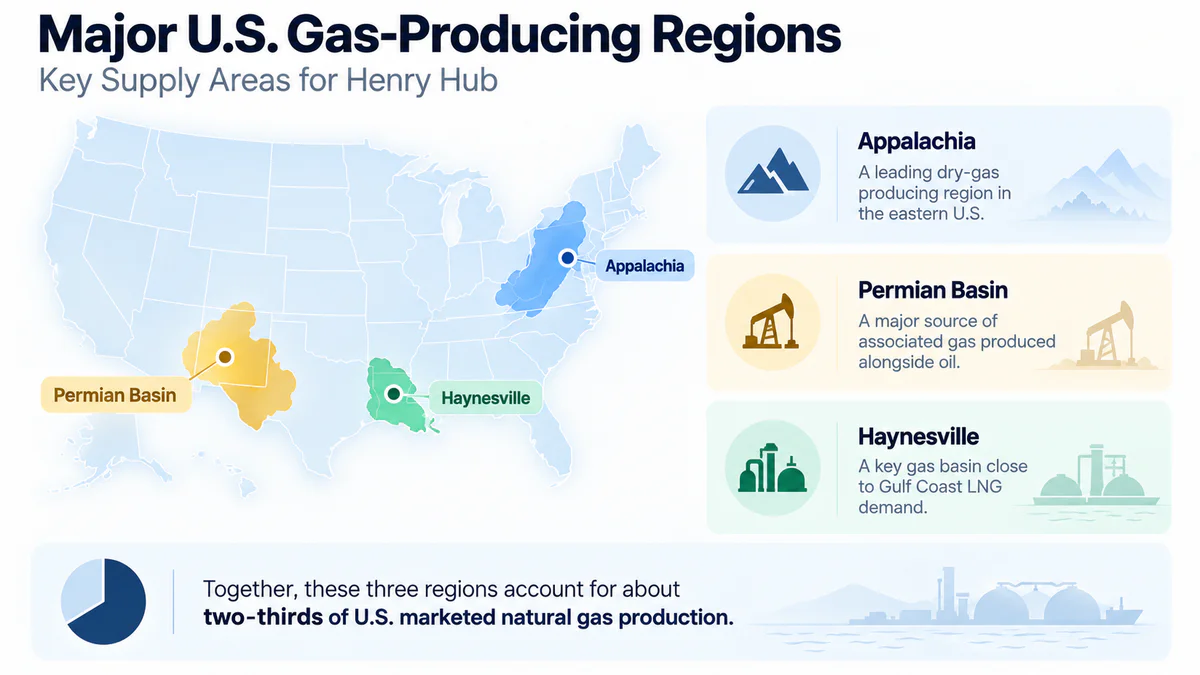
The largest production centers include the Appalachians, the Permian Basin, and Haynesville. In 2025, these three regions together accounted for about two-thirds of the US's marketed natural gas production.
However, the economics of production in these areas differ. Haynesville is largely focused directly on gas and is located relatively close to the LNG infrastructure of the Gulf Coast. In the Permian Basin, a significant portion of the gas is associated gas, which is produced alongside oil.
Therefore, natural gas supply can increase even with a relatively low Henry Hub if oil production in the Permian remains economically attractive.
Natural Gas Storage in the U.S.
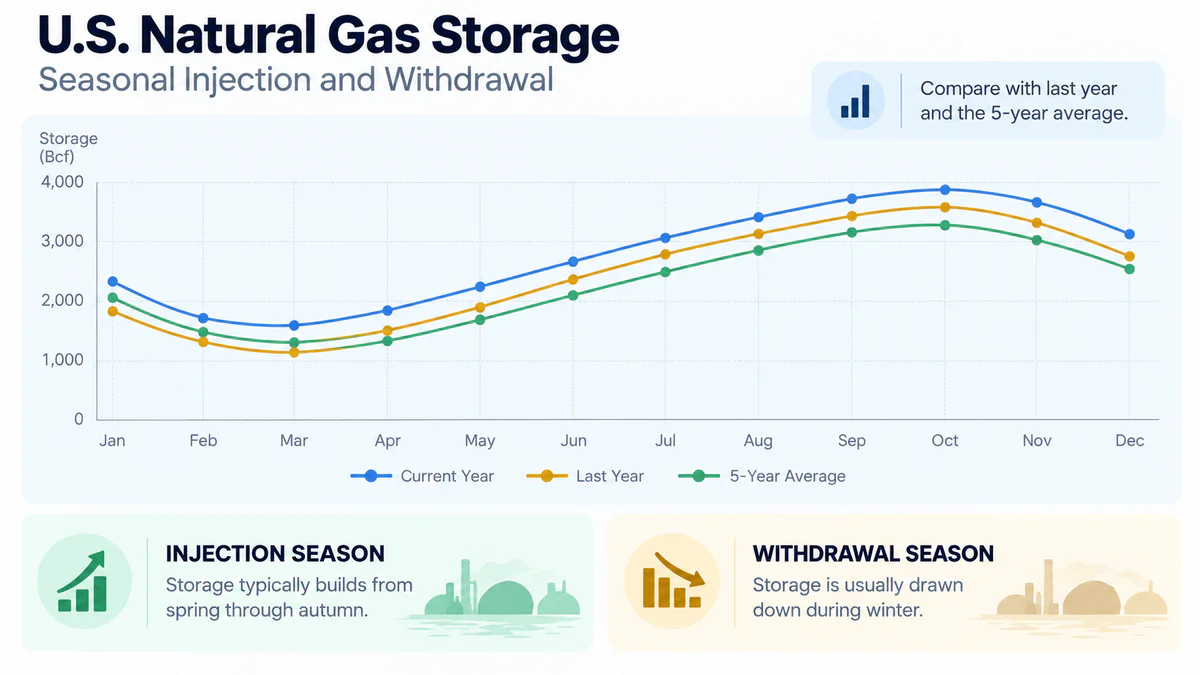
Underground storage helps to offset the difference between relatively stable production and highly variable seasonal demand.
The market typically goes through two main periods:
- Injection season — primarily spring, summer, and fall, when some gas is directed into storage.
- Withdrawal season — mainly winter, when stored volumes are used to meet heating demand.
The EIA publishes the Weekly Natural Gas Storage Report weekly. The market looks not only at the change in stocks for the week but also compares the current level with the same period last year and the five-year average.
If stocks are significantly above the seasonal norm, the market usually has a larger reserve. With low stocks, Henry Hub's sensitivity to cold weather or supply disruptions may increase.
Weather and Natural Gas Prices
Natural gas is one of those commodity assets that weather can directly influence through physical consumption.
In winter, gas is used for heating residential and commercial spaces. Prolonged cold increases demand, and an unexpected cold snap can particularly impact the price if stocks are already low.
In summer, the connection is through electricity. High temperatures increase air conditioning use and electricity demand. Since natural gas remains the largest source of U.S. electricity generation, hot weather can significantly increase gas consumption by power plants.
Two indicators are used to assess weather demand:
- HDD — Heating Degree Days, indicating potential heating needs;
- CDD — Cooling Degree Days, related to cooling needs.
The market reacts not only to actual temperatures but also to forecasts. If meteorological models start showing colder or hotter weather, futures can change direction even before real consumption increases.
Seasonality of Natural Gas
Henry Hub seasonality is linked simultaneously to weather, electricity demand, and the storage cycle.
In winter, heating usually becomes the main factor. In spring, active stock replenishment begins. In summer, gas consumption by power plants increases, especially during prolonged heat periods. In fall, the market assesses whether enough stocks have been accumulated for the next heating season.
Therefore, the simple rule "natural gas becomes more expensive in winter" does not always apply. A mild winter with high stocks can create a gas surplus, while a hot summer and high gas consumption by power plants can significantly tighten the balance long before the cold season arrives.
LNG Export
The development of U.S. liquefied natural gas exports has become one of the largest structural changes in the Henry Hub market.
For maritime transportation, natural gas is cooled to about −260°F and converted to a liquid state. Its volume decreases by about 600 times, allowing large quantities of gas to be transported by specialized LNG tankers.
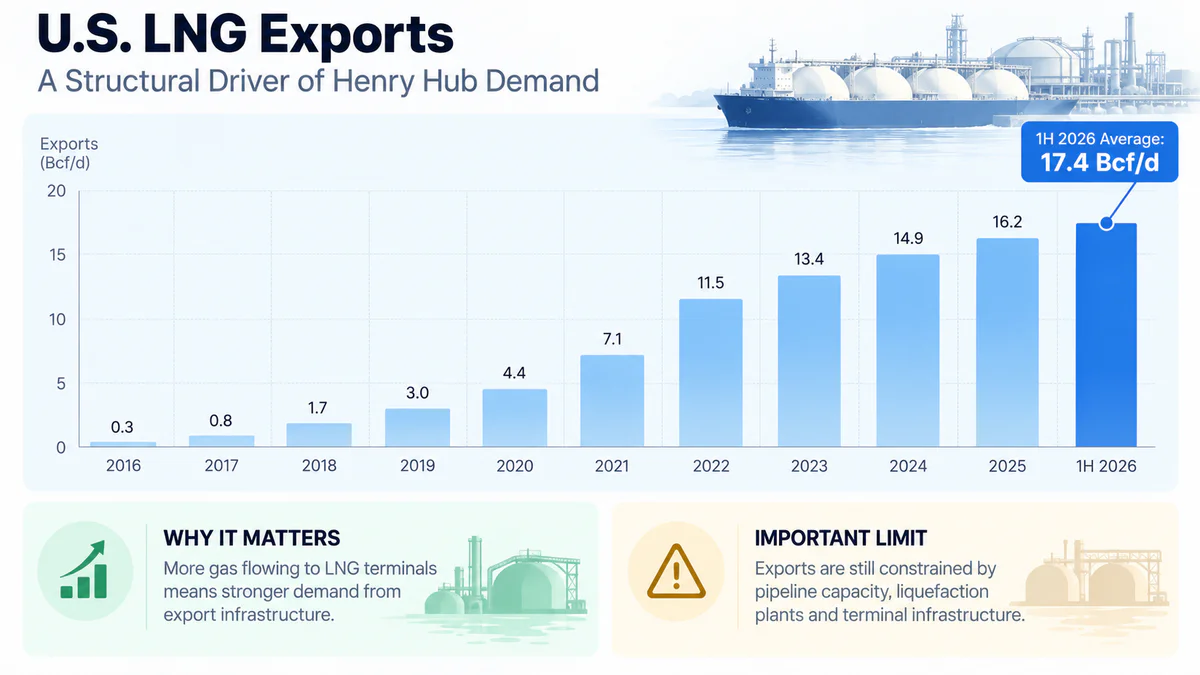
For the U.S. market, LNG terminals are major consumers of pipeline gas. The more natural gas is sent to LNG plants for subsequent liquefaction and export, the higher the domestic demand for gas from export infrastructure.
In the first half of 2026, U.S. LNG exports averaged about 17.4 Bcf per day. The growth of export capacity gradually strengthens the connection between Henry Hub and overseas markets.
However, this connection is not unlimited. Even a very high gas price in Europe or Asia does not allow any volume of American gas to be redirected there instantly. Exports are limited by the capacity of pipelines, liquefaction plants, and terminals.
Electric Power and Gas Demand
Power plants are among the largest consumers of natural gas in the U.S. In 2025, gas accounted for about 41% of the country's large-scale electricity generation.
The volume of consumption depends on several factors. In hot weather, demand for air conditioning increases. With low output from wind or solar power plants, gas generation may take on additional load. At the same time, the relative cost of fuel and competition between gas and other power plants matter.
A high Henry Hub price can itself limit some future demand if the energy system can use cheaper alternatives.
Pipelines and Infrastructure
Natural gas is much more dependent on infrastructure than many liquid commodities. Most supplies within the U.S. are moved via pipelines, so regional prices depend on available capacity.
If production grows rapidly and gas export capabilities are limited, a local surplus arises. In such a situation, the regional price may significantly drop relative to Henry Hub.
Conversely, the shutdown of a major pipeline in a high-demand region can lead to a gas shortage and a sharp increase in local costs.
New pipelines can also significantly change the market. They do not directly increase national production but allow for the redistribution of supply between regions and connect producers with major consumers or LNG terminals.
Oil Market and Associated Natural Gas
Henry Hub does not mirror oil dynamics, but the oil market can influence the supply of natural gas.
The Permian Basin is particularly important, where a significant portion of gas is produced alongside oil. If oil wells remain profitable, associated gas production may increase regardless of how attractive the current gas price is.
Therefore, for supply analysis, it is sometimes useful to look not only at gas rigs but also at oil activity in basins where a large volume of associated gas is produced.
Key Indicators to Monitor When Analyzing Henry Hub
Fundamental analysis of Henry Hub is best built around several data groups. No single indicator should be interpreted in isolation from the others.
| Indicator | What It Shows |
| Henry Hub spot price | current physical market condition |
| Natural Gas Futures | expectations for future months |
| EIA Natural Gas Storage | level and weekly change in stocks |
| Stocks relative to five-year average | market position relative to seasonal norm |
| Gas Production | natural gas supply |
| LNG Feedgas and LNG Exports | export demand |
| Power Burn | gas consumption by power plants |
| HDD and CDD | temperature impact on potential demand |
| Pipeline Flows | gas movement and infrastructure constraints |
| Futures Curve | seasonal expectations and balance of different contract months |
For example, a high stock volume may appear as a price pressure factor. But if a forecast of prolonged cold weather emerges and production declines, the market may quickly reassess the future balance.
Similarly, a strong weekly withdrawal from storage does not necessarily indicate a shortage: for a specific time of year, such a change may remain typical.
Henry Hub and TTF
Unlike oil, natural gas does not have a single global price. Its transportation requires either pipeline infrastructure or prior liquefaction, sea transport, and subsequent regasification.
Different markets use their own price benchmarks:
- Henry Hub — USA;
- TTF, Title Transfer Facility — Europe;
- JKM, Japan Korea Marker — one of the main benchmarks of the Asian LNG market.
Their prices can vary significantly. If a gas shortage arises in Europe, TTF can quickly rise, while Henry Hub remains relatively stable due to sufficient supply within the USA.
Transferring American gas to the European or Asian market requires delivery to an LNG terminal, liquefaction, sea transport, and regasification. Each stage has its own cost and limited capacity.
As American LNG develops, the connection between Henry Hub, TTF, and JKM becomes stronger, yet these benchmarks still reflect different physical markets.
How to Trade Natural Gas
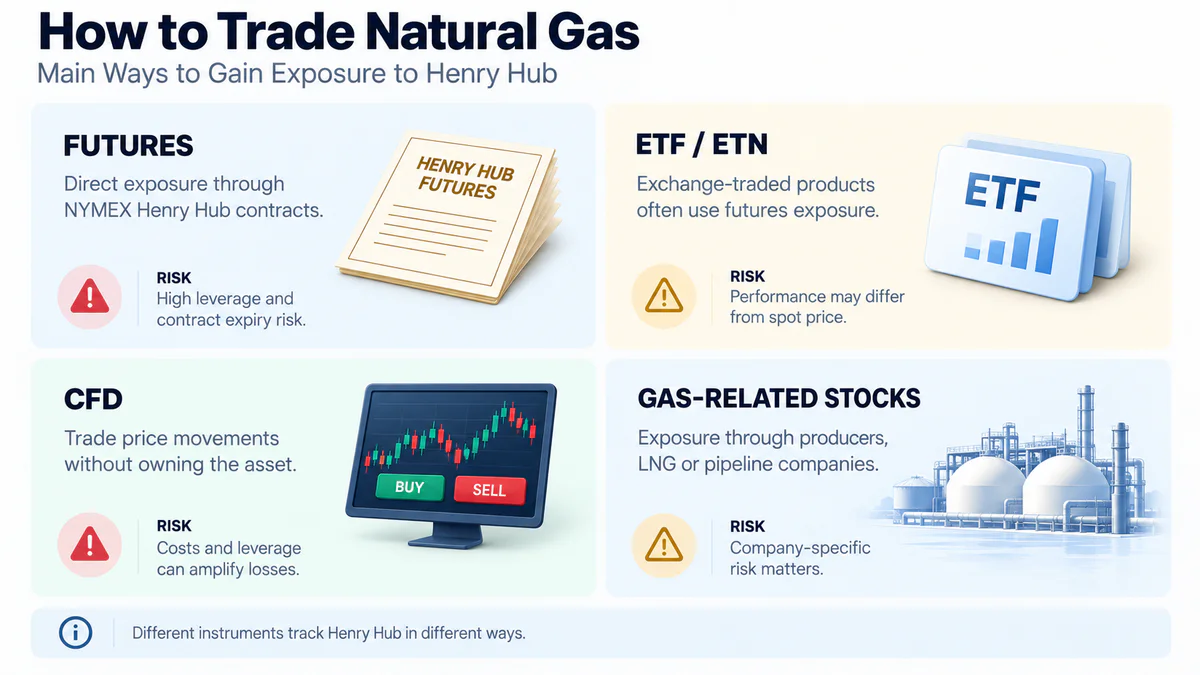
There are several ways to gain financial exposure to Henry Hub.
Futures. Henry Hub Natural Gas Futures are most directly linked to the exchange price of gas. The standard NG contract corresponds to 10,000 MMBtu and requires an understanding of margin requirements, expiration, and the physical delivery mechanism.
Exchange-Traded Products. ETFs, ETNs, and other products can provide access to gas dynamics without directly dealing with the standard futures contract. However, many of them use futures contracts, so the result may differ from changes in the spot price.
CFD. These instruments allow trading on the price change of the underlying asset without owning physical gas. It is important to consider the spread, leverage, rollover cost, and which specific contract underlies the quote.
Company Stocks. Another option is gas producers, midstream companies, or LNG infrastructure operators. However, a company's stock is not equivalent to a direct position in Henry Hub. Its value is additionally influenced by expenses, debt, production volume, hedging strategy, and management quality.
Natural Gas ETFs and Rollover
Physical storage of natural gas is complex and requires specialized infrastructure. Therefore, exchange-traded products focused on the gas market often gain exposure through futures.
When a contract approaches expiration, it must be replaced with the next one. This process is called rollover.
In contango, the next contract is more expensive than the expiring one. Regularly rolling over to more expensive contracts can worsen the product's result relative to simple spot price changes.
In backwardation, the next contract is cheaper than the nearest one, and the effect can work in the opposite direction.
This is why the performance of a natural gas ETF cannot be directly compared only with the Henry Hub spot price chart. The structure of the futures curve, product methodology, rollover timing, and fees are important.
Main Risks of Trading Natural Gas
Natural gas is considered a volatile energy asset. The main risks can be divided into several groups:
- market volatility — quotes can quickly react to changes in weather, stocks, and production;
- leverage — a small percentage movement of the underlying asset can significantly change the result of a futures or CFD position;
- rollover risk — long-term holding of futures exposure depends on the curve structure;
- infrastructure risk — a pipeline or LNG terminal shutdown can sharply change the local balance;
- weather risk — new forecasts can sometimes significantly change the expected demand in just a few trading sessions;
- regional risk — prices of individual American hubs can move quite differently from Henry Hub.
In certain regional markets in the US, the price of gas has periodically turned negative. This can occur when production exceeds current demand and the available capacity to transport gas via pipelines. Such episodes are particularly known at Waha Hub in the Permian Basin.
This does not mean that a negative price at a regional hub automatically extends to Henry Hub.
Henry Hub as an indicator of the US gas market
Henry Hub is monitored not only by gas traders. Its price reflects the interaction of several major segments of the American energy sector — production, storage, heating, electricity generation, and LNG export.
Low cost can be associated with high supply, large stocks, or mild weather. But it can also occur during a period of production growth with a sufficiently strong economy. Conversely, a high price may reflect high demand, supply issues, or temporary infrastructure stress.
Therefore, Henry Hub cannot be used as a simple indicator of the US economy's condition.
Instead, it is better viewed as an indicator of the current and expected balance of the American gas market. To interpret the price, it is necessary to simultaneously consider production, storage, weather, electricity demand, LNG, and infrastructure.
About commodities
Current price of Henry Hub natural gas, chart and quotes. We analyze how the price of gas in the US is formed, the role of weather, storage, production, and LNG exports, and what is important to consider when analyzing the market.