


Sugar No. 11
SB


Sugar No. 11 is a futures contract for raw cane sugar traded on ICE Futures U.S. The contract serves as an international price benchmark for raw sugar, allowing market participants to trade on its price changes and hedge against price risks.
| Parameter | Value |
|---|---|
| Exchange Instrument | Sugar No. 11 Futures |
| Ticker | SB |
| Exchange | ICE Futures U.S. |
| Underlying Commodity | Raw cane sugar |
| Quotation Unit | US cents per pound |
| Contract Size | 112,000 pounds (≈50.8 tons) |
| Minimum Price Fluctuation | 0.01 cent per pound ($11.20 per contract) |
| Delivery Type | Physical delivery, FOB |
Factors Influencing SB Sugar Price
The price of SB sugar depends on global supply, demand, and international trade conditions. The following factors have the most significant impact on quotations:
- Cane Harvest and Processing. Increased production in Brazil, India, and Thailand can expand sugar supply and exert pressure on prices.
- Ethanol Production. The allocation of extracted sugars between sugar production and biofuel affects the volume of sugar available to the market.
- Exports from India and Thailand. Supply restrictions can reduce global supply and support SB quotations.
- Global Stocks. Low stocks increase market sensitivity to production and supply disruptions.
- Brazilian Real Exchange Rate. Changes in the exchange rate against the US dollar affect the revenues of Brazilian exporters and the competitiveness of their products.
The impact of each factor depends on the overall market situation and the expectations of market participants. Therefore, a change in one indicator does not always lead to a corresponding price movement for sugar.
Structure of the Global Sugar Market
The global sugar market brings together cane and beet sugar producers, processing plants, exporters, refineries, and industrial buyers. SB quotations primarily reflect the raw cane sugar market, which is supplied for further processing or international trade. Its price is influenced not only by the overall global harvest but also by the amount of sugar available for export, as a significant portion of production is consumed domestically.
Brazil, India, and Thailand are particularly important for analyzing SB. In these countries, sugar production depends on cane yield, sugar content, and the operation of processing plants, but the market structure varies. Brazil plays a key role in international exports, India is significantly influenced by domestic consumption and government regulation, and Thailand is a notable supplier to Asian markets.
Brazil: Production, Sugar Content, and Export
Brazil is the world's largest sugar exporter, with the Centre-South region forming the core of its cane processing. Changes in production in this region can significantly influence expectations regarding global supply, so traders monitor not only the volume of harvested crops but also the amount of processed cane, its quality, and the proportion of extracted sugars directed towards sugar production.
An important source of statistics is the industry association UNICA. Its data allows for assessing how quickly processing plants are progressing through the season, how sugar content in raw materials is changing, and how much final product is entering the market. However, increased cane processing does not always mean a proportional increase in sugar production: some extracted sugars are used for ethanol production.
Logistics and Brazil's export capabilities are also of additional importance. Even high sugar production may not lead to an immediate increase in international supplies if port capacity is limited, shipment delays occur, or sellers change the timing of product sales.
India: Domestic Market and Export Policy
India is one of the largest sugar producers and consumers. Therefore, assessing its impact on SB requires distinguishing between total production, domestic use, stocks, and the volume of product that can be directed for export. A significant portion of sugar is sold domestically, and the availability of international supplies also depends on government decisions.
Export restrictions or permissions can change the supply of sugar on the global market. However, the impact of such measures is determined by their scale and how they align with the expectations of market participants. For example, export permission does not necessarily lower quotations if the market had already anticipated a larger volume of supplies.
The Indian market is also linked to ethanol production, for which various types of sugar raw materials can be used. Therefore, when analyzing, it is important to consider not only the cane harvest but also the allocation of extracted sugars between processing directions.
Thailand and Supplier Competition
Thailand is one of the key sugar exporters, especially for Asian markets. Production depends on planting areas, rainfall, yield, and cane sugar content. Unfavorable weather can reduce not only the crop mass but also the output of finished sugar during processing.
Australia, Central American countries, and other suppliers also participate in international trade. Their influence varies depending on harvest, domestic demand, and export capabilities. Therefore, the forecast for SB sugar prices should consider the aggregate supply, not just the production figures of one country.
How SB Sugar Differs from White Sugar
The Sugar No. 11 Futures contract (also Sugar #11) is focused on raw cane sugar, which typically requires further refining to produce white sugar. This product differs from finished white sugar in terms of impurity composition, color, and quality requirements. Retail sugar can be produced from both cane and beet.
ICE offers a separate contract, White Sugar Futures, with the code W, also known as White Sugar No. 5. It reflects the white sugar market, has its own delivery standards, and is quoted in US dollars per metric ton. Thus, SB and W belong to different commodity segments, although their prices depend on the overall state of the sugar market.
Why Sugar Polarization Matters
The quality of raw sugar is assessed by several indicators, including polarization, which is related to sucrose content. The ICE standard for Sugar No. 11 is based on an average polarization of 96°, with the minimum allowable polarization for deliverable sugar increasing to 97° starting from the March 2028 contract.
Therefore, when analyzing the physical market, one cannot assume that any batch of raw sugar fully complies with the SB standard. Delivery conditions, origin, quality, and specific buyer requirements can form separate premiums or discounts.
What the price difference between raw and white sugar shows
Comparing the prices of SB and White Sugar Futures (W) converted to a common unit of mass allows for evaluating the price spread between raw and white sugar, but not the actual refining margin. For a correct comparison, it is necessary to consider the currency, product quality, and relevant delivery terms.
An increase in the price difference may reflect changes in demand for white sugar, availability of processing capacities, or production costs. However, it does not equate to guaranteed profits for a refining company, as it does not include all technological, financial, and logistical expenses.
How sugar production is linked to ethanol
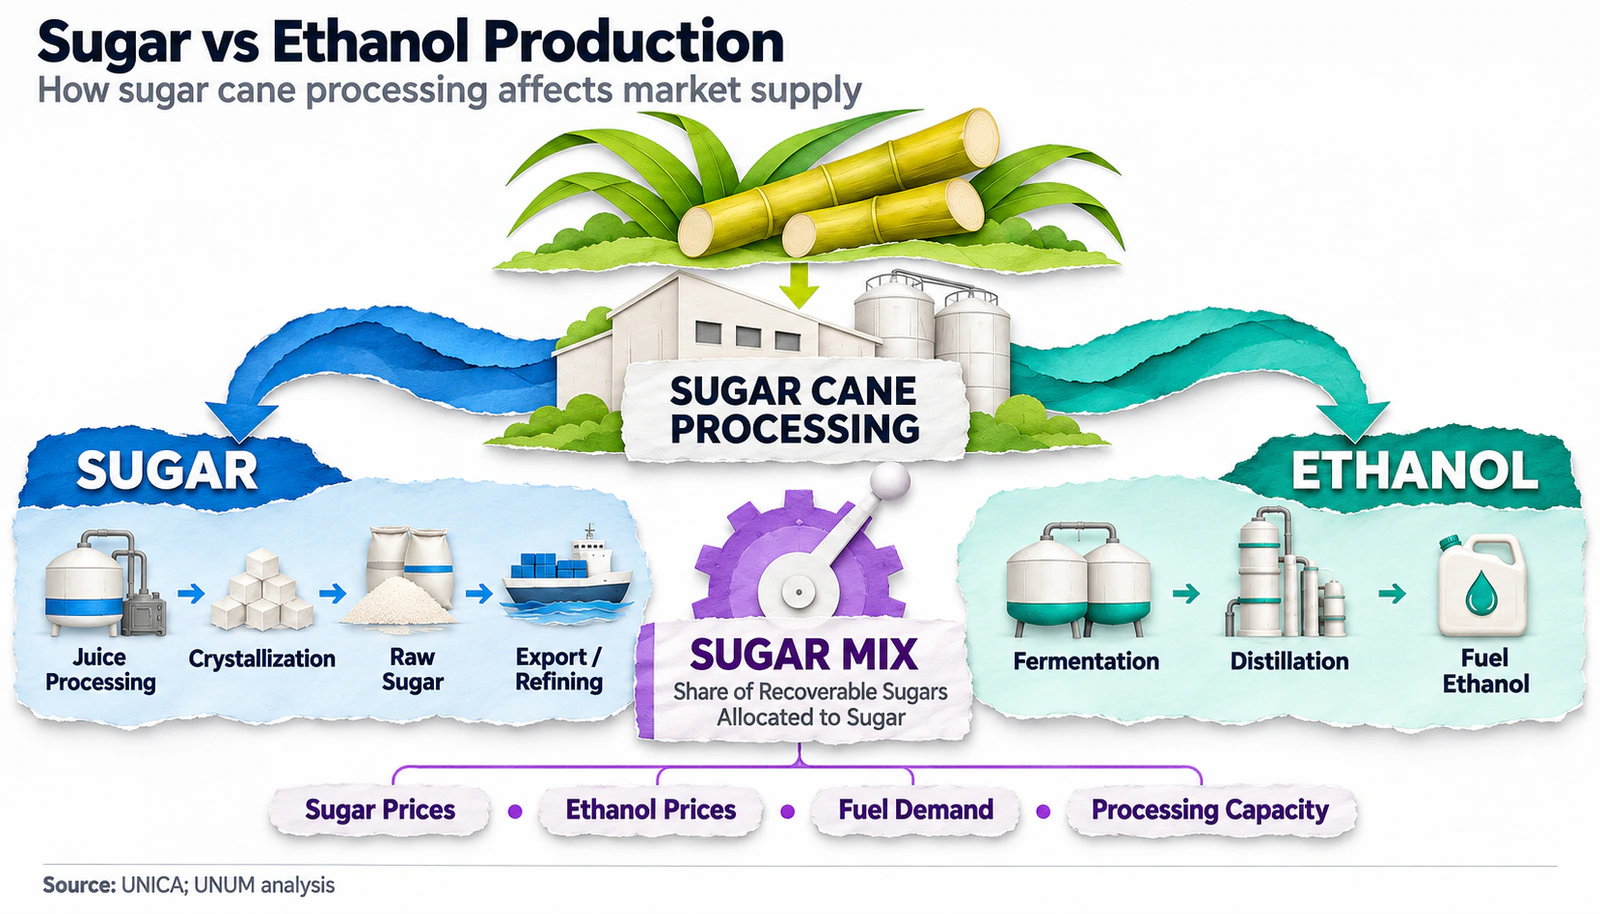
One of the main features of the sugar market is the ability to process sugarcane into two in-demand products: sugar and fuel ethanol. This link is especially important for Brazil, where many companies have capacities for both directions. The decision on raw material allocation depends on the relative profitability of production, sales conditions, technological capabilities, and previously concluded contracts.
If ethanol production becomes more attractive, companies may increase its share, limiting sugar output, all else being equal. Conversely, if sugar sales conditions improve, processors may direct more of the available raw material to sugar production. This mechanism does not mean that a plant can instantly and without limitations fully switch from one product to another.
Sugar mix: an indicator for supply analysis
In Brazilian industry statistics, the sugar mix indicator is used — the share of available sugar in cane raw material, converted to ATR, directed to sugar production rather than ethanol. Along with the volume of processed cane and its sugar content, it helps assess potential sugar output.
ATR (Açúcar Total Recuperável) is an indicator of the total amount of technologically recoverable sugars in cane, usually expressed in kilograms per ton of raw material. It allows for considering not only the mass of processed cane but also the amount of sugars available for the production of the final product.
For example, if cane processing remains relatively stable, and the share of extractable sugars directed to sugar production increases, the sugar supply may grow. However, for a comprehensive assessment, it is also necessary to consider sucrose yield and the efficiency of processing enterprises.
Why fuel prices do not always match SB dynamics
The economics of ethanol production depend on fuel demand, domestic prices, regulation, and processing plant utilization. Rising gasoline prices may increase ethanol's attractiveness, but the impact on SB depends on the conditions of Brazil's fuel market and the actual ability of companies to change production structure.
Therefore, there is no constant unambiguous relationship between oil, ethanol, and sugar. For analysis, it is more important to compare price changes with the dynamics of the sugar mix, processing volumes, and actual sugar output.
What affects the SB sugar price: weather, stocks, and trade
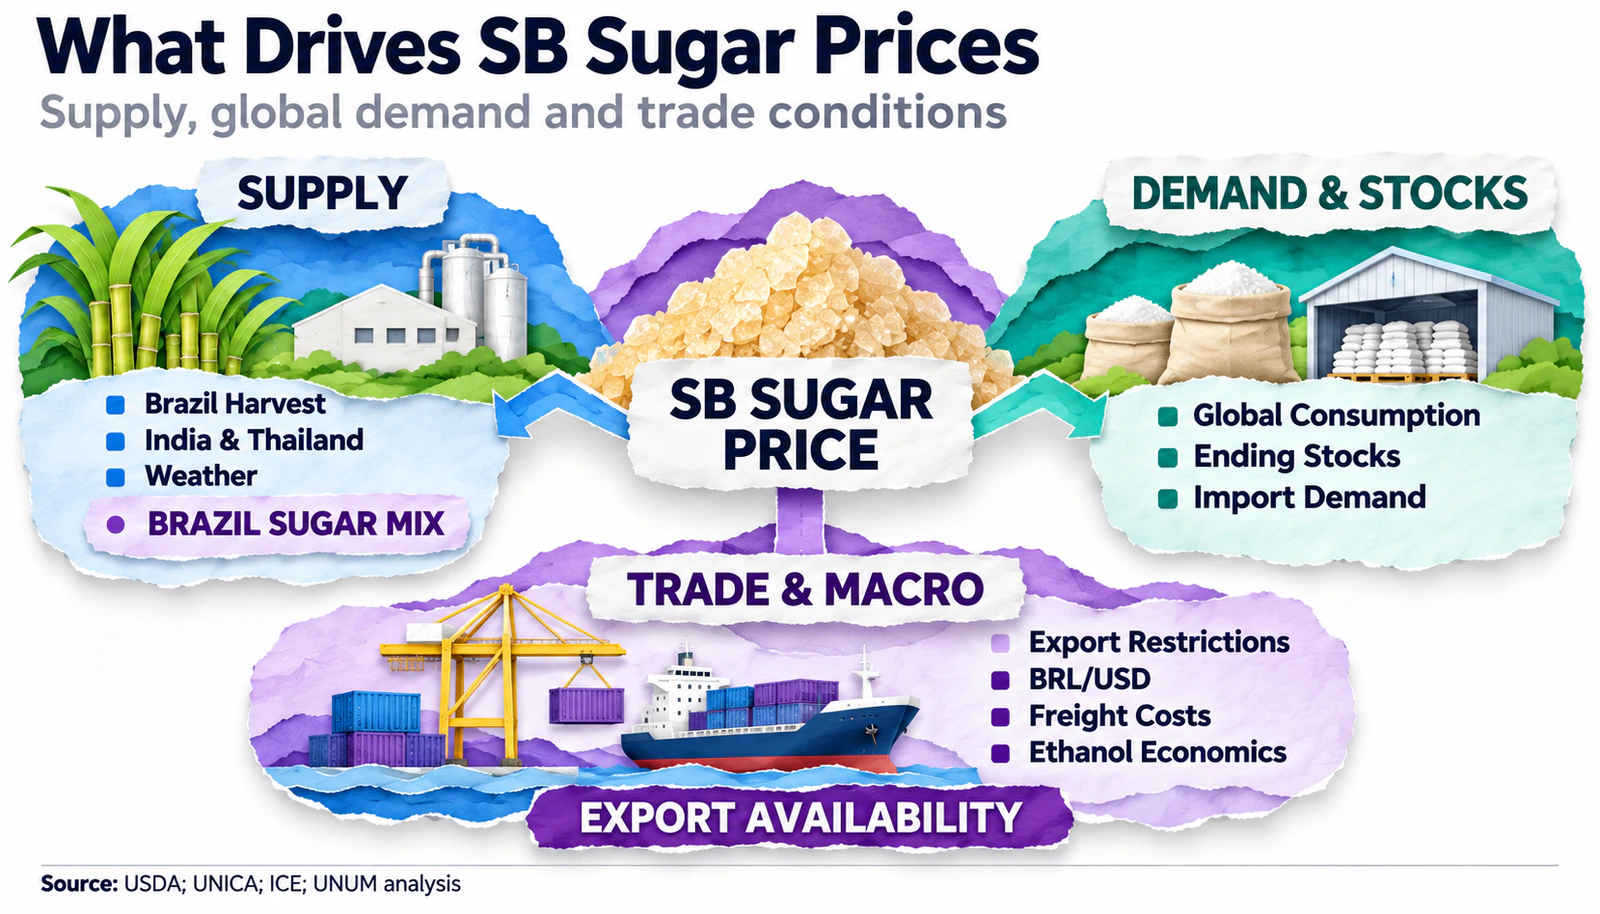
To understand SB quotes, it is necessary to evaluate factors in aggregate. Adverse weather can reduce the harvest, but at the same time, an increase in stocks or export offerings from another country can limit price growth. Therefore, the key is not a single event, but its impact on the overall balance of available sugar.
Weather conditions and sugarcane harvest
Sugarcane is sensitive to moisture availability, temperature, and the length of the growing period. Drought, excessive rainfall, and frosts can worsen plant conditions, reduce yields, or delay harvest. The amount of sugar obtained depends not only on the mass of the cane but also on its sugar content, so changes in raw material quality can affect output even with stable processing volumes.
For analysis, it is especially useful to compare weather data with crop conditions and production reports. For example, prolonged rainfall during harvest can temporarily reduce processing and shipments but does not necessarily mean a similar reduction in the final harvest for the season.
Seasonality of sugar production
In Brazil's Center-South region, the main cane processing season usually occurs from spring to the end of the year, although specific timing depends on weather and production decisions. Therefore, processing rates should be compared with characteristic values for the corresponding season period, rather than evaluated in isolation.
In India and Thailand, the growing and processing seasons differ from those in Brazil. This means the global market receives new supply at different times of the year. However, seasonality does not create a guaranteed direction for quotes: prices depend on the expected balance, stocks, and competition among exporters.
Global stocks and export availability
The global sugar balance is determined by production, consumption, and stocks. In national calculations, ending stocks can be represented as follows:
Ending stocks = beginning stocks + production + imports − domestic consumption − exports.
In the global balance, international trade redistributes supply between countries. When comparing statistics, it is necessary to account for the conversion of white and raw sugar into a comparable equivalent.
A high yield in a country with significant domestic consumption or export restrictions does not necessarily increase available international supplies. Conversely, a reduction in stocks by major exporters can make the market more sensitive to weather problems and transportation delays.
Brazilian Real Exchange Rate and Logistics Costs
Sugar SB is quoted in US dollars, while a significant portion of Brazilian producers' costs are formed in reals. Therefore, changes in the BRL/USD pair can affect exporters' revenues in local currency, the competitiveness of supplies, and sales strategy.
However, a weakening real does not guarantee a decrease in the SB price. The financial results of producers are also influenced by currency hedging, production costs, transportation costs, and the terms of previously concluded contracts. Additional factors include sea freight, port operations, and the availability of export infrastructure.
Which Data to Use for Fundamental SB Analysis
When analyzing the sugar market, it is useful to separate data on production, international trade, and financial conditions. The most significant sources include UNICA, USDA Foreign Agricultural Service, national statistics of producing countries, and ICE exchange data. Each source answers a specific question, so it is more reliable to compare several indicators than to rely on a single publication.
| Source or Indicator | What to Analyze | How to Use |
| UNICA | Cane processing, sugar production, ATR, and sugar mix | Assess Brazil's supply |
| USDA Sugar: World Markets and Trade | Production, consumption, export, import, and stocks | Compare global balance |
| India Statistics | Harvest, domestic stocks, and export decisions | Assess availability of international supplies |
| Thailand Statistics | Production, sugar content, and export | Analyze Asian market supply |
| Brazil Ethanol Market | Production, demand, and ethanol prices | Evaluate attractiveness of cane processing |
| BRL/USD | Brazilian real to dollar exchange rate | Analyze export economy |
| ICE SB | Quotes, spreads, volumes, and open interest | Evaluate futures market condition |
How to Interpret UNICA Data
For Brazil, it is especially important to compare three parameters: the volume of processed cane, the sugar content in the raw material, and its usage structure. The ATR indicator allows assessing the amount of technologically extractable sugars, while the sugar mix shows the share of these sugars directed to sugar production.
An increase in processing may be accompanied by a decrease in sugar yield if the quality of the raw material deteriorates or processors direct a larger share to ethanol. Therefore, individual production indicators without context can create a misleading impression of available supply.
How to Analyze USDA Data
The Sugar: World Markets and Trade report allows assessing international production, consumption, trade, and carryover stocks. To evaluate the SB price, it is important to look not only at global results but also at the distribution of supplies between exporting and importing countries.
When comparing forecasts, it is necessary to consider marketing years and units of measurement. Different types of sugar may be converted to raw sugar equivalent, so indicators from different publications are not always comparable without additional verification of the methodology.
How to Create a Price Movement Scenario
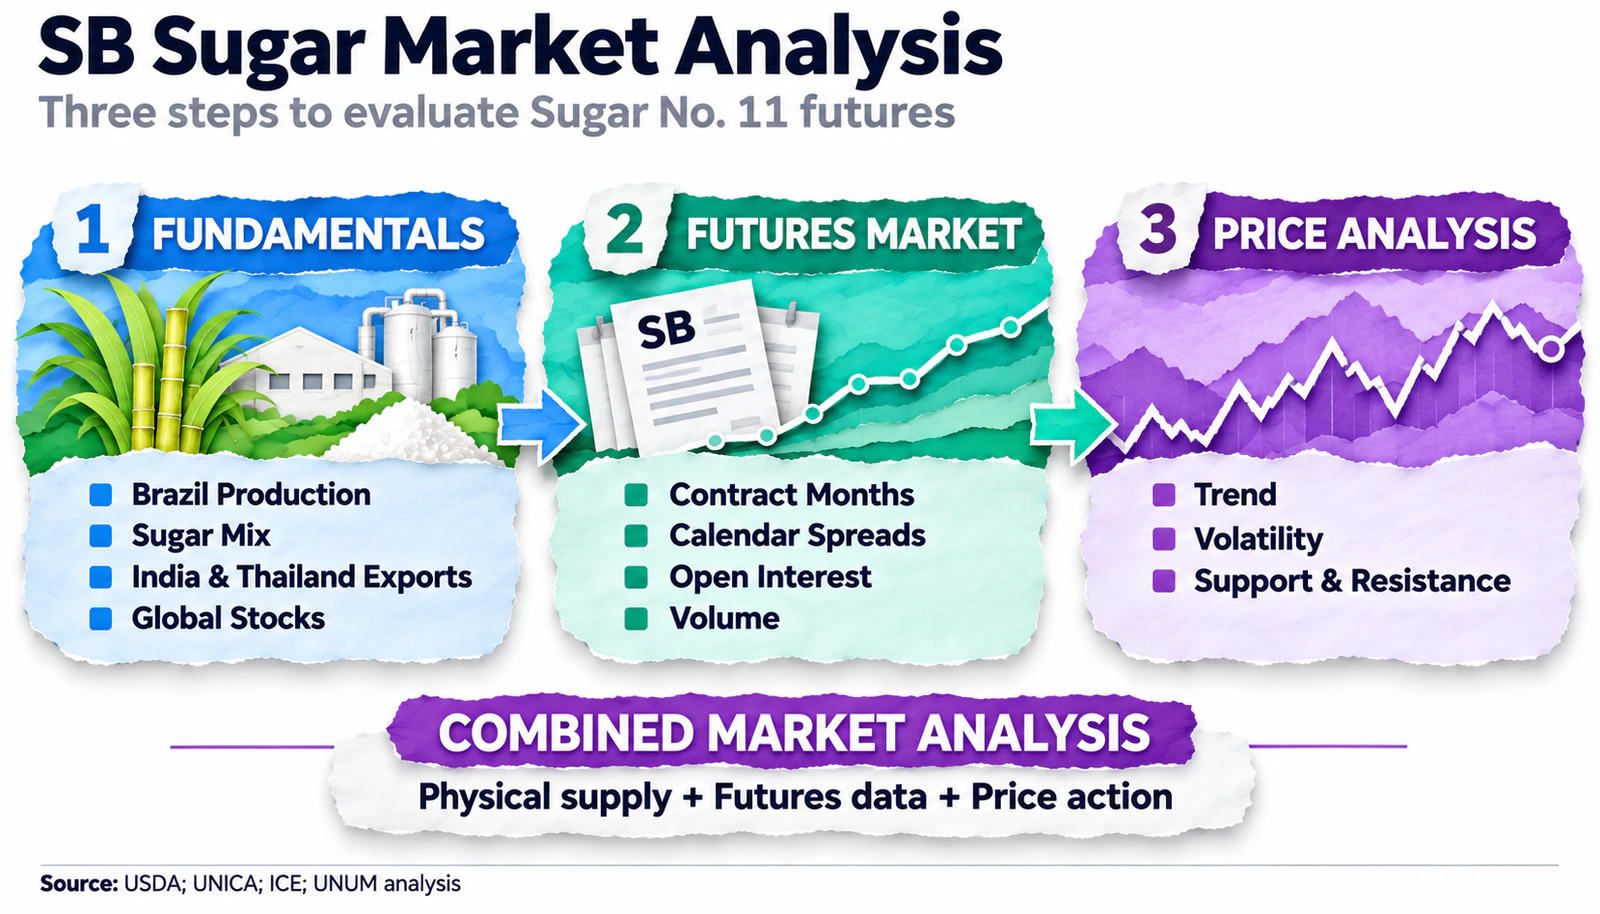
Based on these indicators, several scenarios for SB price changes can be constructed. The following sequence is convenient for this purpose:
- Assess sugar production in Brazil and changes in sugar mix.
- Compare forecasts for India and Thailand with global import demand.
- Check available stocks and possible export restrictions.
- Study the BRL/USD exchange rate and the ethanol market situation.
- Analyze the SB futures curve and changes in trading activity.
For example, a reduction in Brazil's supply with stable global demand may support quotes, while an increase in sugar mix in favor of sugar along with expanded Indian exports may put pressure on the price. However, the market reaction depends on which events are already priced in.
How SB Sugar Quotes Are Formed on ICE
SB sugar quotes on ICE reflect participants' expectations regarding raw sugar supply and future delivery conditions. Sugar on the ICE exchange is traded through Sugar No. 11 futures contracts with various expiration dates. The price of each contract is formed taking into account the expected conditions for raw sugar delivery in the corresponding period.
According to ICE terms, sugar is delivered on FOB terms to the recipient's vessel at an approved port as per contract rules. Sea transportation to the final destination is not included in this price basis.
Contract Size and Position Cost Calculation
A standard SB sugar futures contract corresponds to 112,000 pounds, or approximately 50.8 metric tons. The price is quoted in US cents per pound, and the minimum price fluctuation is 0.01 cents per pound, or $11.20 per contract.
The nominal position cost is calculated by multiplying the price per pound by 112,000. For example, at a hypothetical quote of 18 cents ($0.18) per pound: $0.18 × 112,000 = $20,160.
A price change of one cent per pound corresponds to a change in position value of $1,120. The financial result depends on the trade direction and is calculated before commissions and other expenses.
How to Convert Sugar Price per Pound to Price per Ton
The sugar price per pound on ICE is expressed in US cents, so before converting to the cost per ton, the quote needs to be converted to dollars. The sugar price per ton is calculated by multiplying the cost per pound in dollars by the factor 2,204.62.
Price per ton in USD = price per pound in USD × 2,204.62.
For example, with a hypothetical quote of 18 cents per pound, the calculated cost would be approximately $396.83 per metric ton.
The conversion shows the cost of the basic commodity in a single unit of mass but does not make the SB price equal to the cost of refined sugar or a physical batch delivered to the buyer.
SB Execution Terms and Schedule Features
Sugar No. 11 futures have main delivery months of March, May, July, and October. The last trading day is the last business day of the month preceding the delivery month. The first notice day occurs on the next business day after the last trading day. A client broker may set earlier position closing dates.
The SB sugar chart can display an individual contract or a continuous series combining different delivery dates. Price gaps or historical quote adjustments may occur when transitioning between contracts, so it's important to know which type of chart is used on the platform.
How to Analyze the Futures Curve and Technical Indicators
A fundamental assessment of production and demand helps understand the reasons for price movements, but for analyzing a specific future, it's also necessary to consider the structure of the forward market. The difference between contract prices with different delivery dates reflects current storage, financing, and sugar availability conditions, as well as participants' expectations.
Contango and Backwardation
When a more distant SB contract is priced higher than the nearest one when comparing selected dates, it is called contango. This structure may reflect the costs of storage and financing of the commodity, as well as the characteristics of the expected supply.
If the nearest contract is priced higher than the more distant one, backwardation occurs. It may indicate an increased cost of sugar available in the near term but is not standalone evidence of a shortage.
For a trader, it's important to consider that when rolling a position between delivery dates, the difference in futures prices affects the strategy results. Therefore, long-term exposure through sequential contract purchases may differ from the dynamics of the spot sugar price.
Technical Analysis of SB Sugar
Technical analysis includes studying price trends, support and resistance levels, moving averages, trading volume, and open interest. These indicators help assess market dynamics and trading activity but do not guarantee future price direction.
It is especially important to compare the chart with production reports from Brazil, changes in export policy, and the dynamics of the ethanol market. Sharp movements can occur when expectations are revised, even if the previous technical trend seemed stable.
Tools for Trading SB Sugar
Sugar trading can be conducted through SB futures, options, CFDs, and individual investment products. These instruments differ in execution conditions, capital requirements, and risk characteristics. The choice depends on the trading strategy, investment horizon, and availability of specific products.
Sugar No. 11 Futures
The SB sugar future allows opening long positions when expecting a price increase and short positions when anticipating a price decrease. Producers, processors, and trading companies also use such contracts to hedge price risks of future purchases and deliveries.
Trading usually involves posting margin, which can be significantly less than the nominal value of the position. Therefore, relatively small price movements can lead to significant potential profits and losses relative to the funds posted.
When choosing a delivery date, it's necessary to consider liquidity, trading volume, open interest, margin requirements, and physical delivery. A trader not planning to receive or deliver sugar should timely close or roll over the position.
Options on Sugar
Options on SB futures allow implementing strategies with various conditions of potential profit and risk. The option buyer receives the rights provided by the contract, while the seller assumes the corresponding obligations.
The cost of an option depends on the price of the underlying future, expected volatility, time to expiration, and other factors. The potential loss for the buyer is usually limited to the premium paid, while the seller's risk depends on the position structure and can be significantly higher.
CFDs on Sugar
CFDs on sugar are over-the-counter derivative instruments that allow trading on price changes without purchasing the physical commodity. When choosing, it's necessary to check which price benchmark the broker uses: not every CFD named Sugar is necessarily linked to the SB future.
For example, a hypothetical CFD position of 10,000 pounds of sugar at a price of $0.18 per pound has a nominal value of $1,800. If the broker's conditions allow for a 1:10 leverage, the initial margin will be $180. With a hypothetical 5% price change, the financial result will be $90 before expenses, corresponding to 50% of the margin posted.
This is a calculated example and does not reflect the specification of a specific broker. The actual quote step, position size, available leverage, spreads, financing costs, and CFD rollover conditions depend on the broker and jurisdiction.
Exchange-Traded Products and Producer Stocks
Investments in sugar can be made through individual exchange-traded products linked to sugar futures or baskets of agricultural commodities if such instruments are available in the respective market. Their returns do not necessarily replicate the change in the nearest SB contract due to fees, asset structure, and position rollovers.
Shares of sugar producers, cane processors, and bioenergy companies provide indirect exposure to the sugar market. However, their value is also determined by corporate results, debt burden, production costs, and currency conditions.
Key Risks of Trading Sugar SB
For SB, the concentration of export supply, the connection of cane processing with the ethanol market, and changes in international trade conditions are of particular importance. These factors can cause significant price fluctuations, especially when new data differs from market participants' expectations.
| Risk | Possible Impact |
| Drought, frost, and heavy rainfall | Changes in yield, sugar content, and processing timelines |
| Change in sugar mix | Increase or decrease in sugar supply |
| Export restrictions | Change in volumes available to global buyers |
| Increase in global stocks | Possible pressure on quotes |
| Currency fluctuations BRL/USD | Reassessment of Brazil's export economy |
| Logistical disruptions | Shipping delays and additional costs |
| High volatility | Sharp changes in position value |
| Leverage and physical delivery | Margin losses and delivery obligations |
When using futures and CFDs, adverse price movements can quickly lead to the loss of initial margin. Protection against negative balance and the possibility of additional obligations depend on the type of instrument, client status, and the rules of the relevant jurisdiction.
Even a stable global demand for sugar does not guarantee the growth of SB. High production in Brazil, increased export supply, and stockpiling can exert pressure on quotes.
Frequently asked questions about Sugar No. 11 (SB)
They reflect different commodity segments. The difference is influenced by the demand for refined sugar, processing costs, availability of raw materials, and international trade conditions. Therefore, the quotes for SB and White Sugar Futures do not have to change in the same way.
If Brazilian processors increase the share of extracted sugars directed towards sugar production, potential supply may grow. However, to assess the impact on SB, it is necessary to consider the volume of processing, the sugar content of the raw material, exports, and market expectations.
A good harvest in one country may be accompanied by a reduction in supply in other regions, export restrictions, or increased global demand. Additionally, it matters what share of extracted sugars is directed towards ethanol production.
It is necessary to check the designation of the month and year of execution. If the platform shows a continuous futures series, one should consider the rules for its construction and possible adjustments when transitioning between contracts.
Data from UNICA allows for refining expectations regarding sugar production in Brazil. The quotes can be most affected by figures that significantly differ from previous market participants' forecasts.
Yes. A futures position can be closed before delivery obligations arise, complying with the exchange and broker requirements. Options, CFDs, and separate investment products may also be available.
The SB contract has standardized requirements for quality, origin, and FOB conditions. The price of a specific batch may additionally consider the characteristics of the product, transportation, insurance, and other commercial conditions.