


Wheat ZW
ZW


Wheat is one of the main grain crops used in the food industry and feed production. This page presents the quotes for the ZW futures on Soft Red Winter Wheat, traded on the CBOT exchange. Its price depends on the U.S. harvest, weather conditions, global demand, stocks, and export competition. For traders and investors, USDA reports, the condition of American crops, and the seasonal dynamics of the grain market are important.
The ZW futures is one of the main benchmarks of the U.S. wheat market, but it does not represent a unified global grain price. On the international market, there are different classes of wheat, the cost of which depends on quality, protein content, purpose, and region of delivery.
What Influences the Price of ZW Wheat
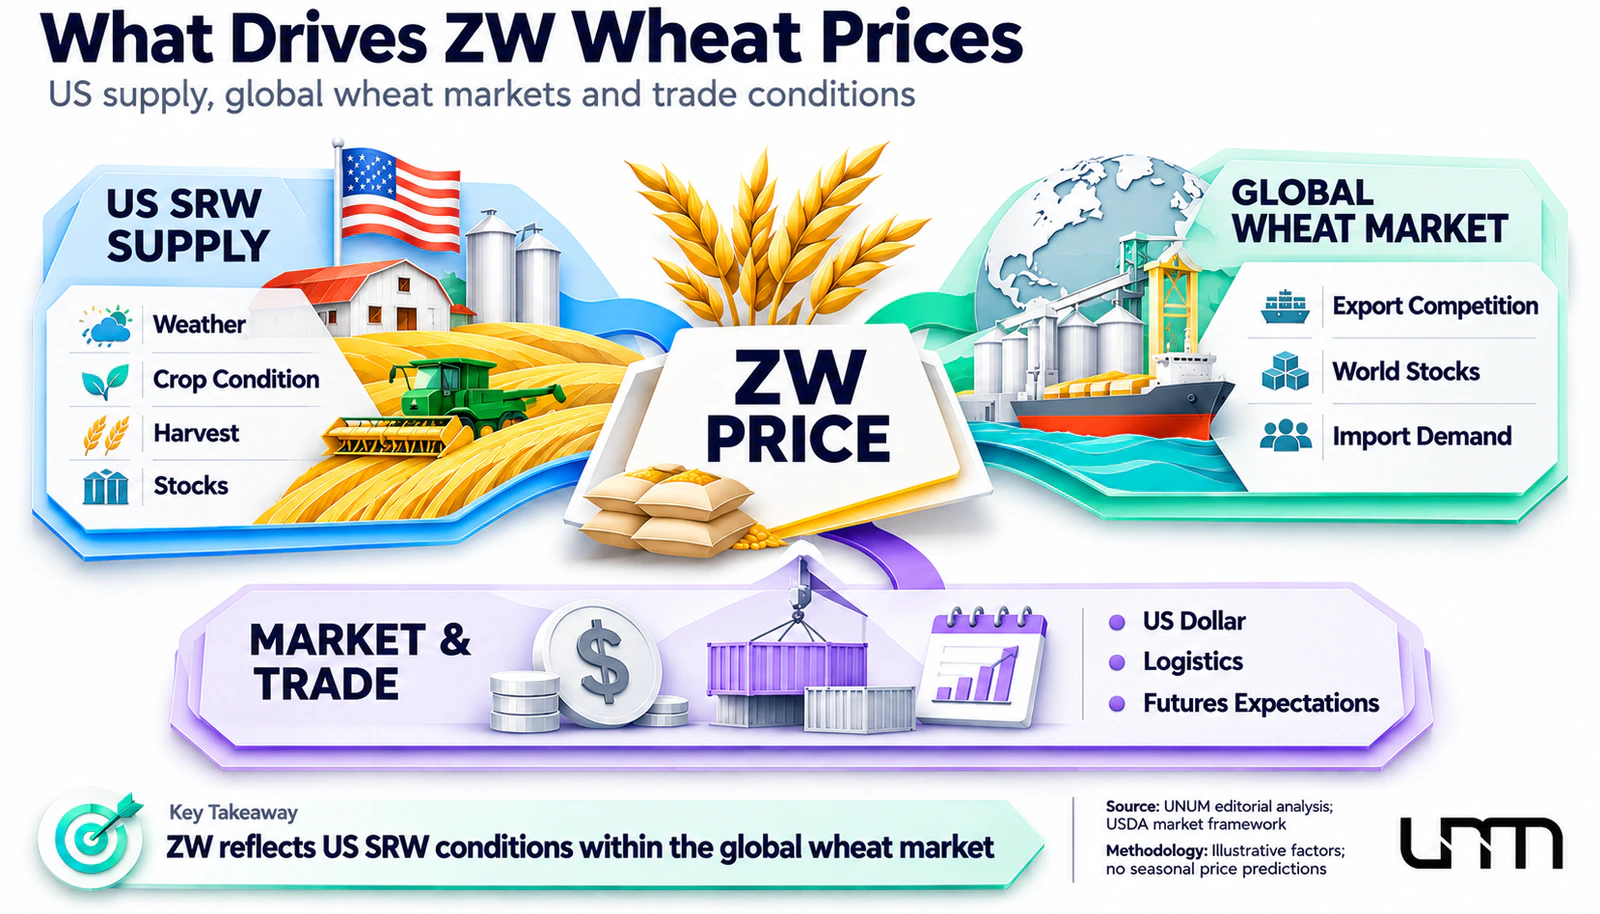
ZW quotes primarily depend on the U.S. soft winter wheat harvest, weather conditions, global stocks, and export demand. A reduction in supply can support the price, while a high yield and increased competition among exporters can put pressure on it. The market reaction depends on how new data differs from traders' expectations.
What Traders Should Monitor:
- USDA WASDE — forecasts of wheat production, consumption, and stocks.
- USDA Crop Progress — the condition of crops and the progress of agricultural work in the U.S.
- U.S. SRW Harvest — acreage, yield, and weather risks.
- Exports and Global Stocks — competitiveness of U.S. wheat and grain availability.
ZW is traded in the form of contracts with different expiration dates, so when analyzing the chart, it is important to consider the selected delivery month. Futures allow opening positions for price increase and decrease, but using margin increases the risk of losses.
How ZW Wheat Differs from Other Types of Wheat
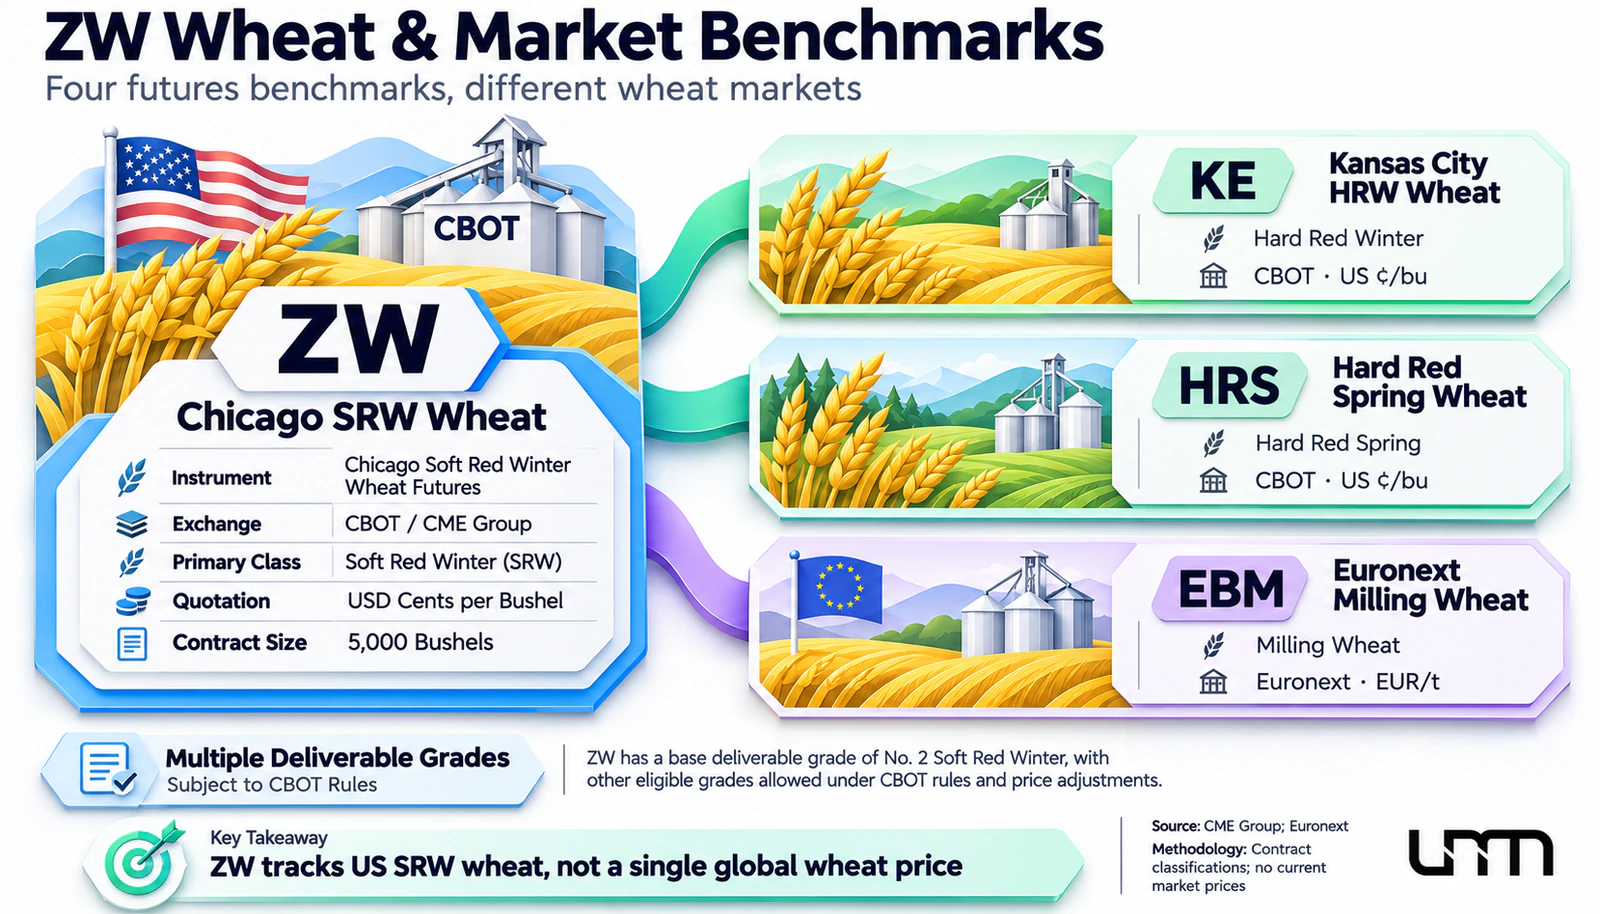
The ZW futures is primarily associated with the Soft Red Winter (SRW) market — soft red winter wheat grown mainly in the eastern and central regions of the U.S. It usually contains less protein than hard bread varieties and is used for producing cookies, crackers, confectionery, and some types of flour. The basic delivery class of the contract is No. 2 Soft Red Winter Wheat, although CBOT rules allow the delivery of certain other classes of grain with established price adjustments.
The U.S. market also features Hard Red Winter (HRW) — hard red winter wheat primarily used in baking, and Hard Red Spring (HRS) — hard red spring wheat with usually higher protein content. HRW has a separate futures contract, Kansas City Wheat (KE), while HRS has its own exchange contract. The European market uses different quality standards, with one of its main benchmarks being Euronext Milling Wheat.
Differences in grain quality, production geography, buyer demand, and delivery conditions explain why prices for individual classes of wheat may vary differently. Therefore, ZW should be considered as a specific am
How ZW Wheat Quotes Are Formed
The price of the ZW futures is formed during exchange trading on CBOT under the influence of supply and demand for contracts with specific expiration dates. Participants consider the expected U.S. SRW harvest, stock conditions, export demand, USDA forecasts, and competition from other producers. Quotes reflect not only the current situation with physical grain but also expectations regarding future deliveries.
To denote a specific futures, the ZW code is followed by the month and year of execution. For example, ZWZ26 refers to the December 2026 contract, and ZWH27 to the March 2027 contract. The main execution months are March, May, July, September, and December. The price difference between contracts may reflect storage costs, seasonal grain availability, and the state of the physical market.
How to Calculate the Cost of a ZW Futures Contract
The nominal value of a standard contract is calculated by multiplying the price of one bushel by 5,000. For example, with a hypothetical quote of 600 cents, or $6 per bushel, the contract value is $30,000. A price change of 10 cents per bushel corresponds to a profit or loss of $500 per position before trading expenses.
Since futures require margin deposits, opening a position usually does not require paying its full nominal value. However, price changes affect the result for the entire contract, not just the margin amount. This creates a leverage effect and increases the risk of significant losses.
How to Convert Wheat Price per Bushel to Price per Ton
On CBOT, the ZW price is expressed in U.S. cents per bushel. To compare with physical markets using metric tons, the quote must be converted to dollars and a standard conversion factor applied.
One bushel of wheat equals 60 pounds, or approximately 27.22 kg. One metric ton contains about 36.7437 bushels.
Price per ton in USD = price per bushel in USD × 36.7437.
For example, a hypothetical $6 per bushel corresponds to approximately $220.46 per ton. This calculation allows for unit comparison but does not account for differences in grain quality, currency, transportation costs, and delivery conditions.
Why the Physical Price Differs from the Exchange Price
The cost of wheat for a specific producer or buyer may differ from ZW due to grain quality, distance to the elevator or port, transportation costs, and local supply and demand balance. The difference between the local cash price and the corresponding futures quote is called the basis.
The basis helps assess how physical market conditions differ from the exchange benchmark. For example, increased transportation costs or changes in local processors' demand can affect the physical wheat price even with relatively stable ZW quotes.
Seasonality of SRW Wheat Cultivation
Soft Red Winter (SRW) wheat in the US is typically sown in the fall. After germination, the plants enter a period of winter dormancy, resume active growth in the spring, and reach harvest maturity in late spring or summer. The specific timing depends on the growing region and weather conditions, so the SRW seasonal calendar does not fully align with the calendar of other wheat classes.
For the ZW market, three stages of the agricultural cycle are particularly important. In the fall, participants assess the planted area and conditions for germination, in the spring — the condition of overwintered plants and yield prospects, and before harvest — the impact of precipitation, temperature, and potential quality losses. Drought, spring frosts, and prolonged rains can significantly alter production forecasts, but their effects depend on the crop's development stage.
Seasonality itself does not determine price direction. Even a favorable SRW harvest in the US can coincide with a rise in ZW if global export supply decreases more sharply or actual data falls short of market expectations.
How Harvest and Global Trade Affect ZW
The cost of ZW is influenced not only by SRW production in the US but also by the competitiveness of American wheat in the international market. Major participants in global trade include Russia, the European Union, Canada, Australia, Ukraine, Argentina, and other suppliers. Changes in their harvest, export policies, and transportation capabilities can redistribute demand among countries and affect US quotations.
Moreover, the total volume of global production does not fully reflect the availability of grain for international trade. A significant portion of the harvest is consumed within producing countries, and individual batches vary in quality and are not always suitable for the same purposes. Therefore, a high global harvest does not guarantee a decrease in ZW prices if available export supply is limited or demand for American wheat remains strong.
Trade restrictions, port disruptions, freight costs, and currency fluctuations also affect the competitiveness of suppliers. It is especially important to monitor export conditions from the Black Sea region, as changes in grain availability from major suppliers can impact international price benchmarks.
How USDA Assesses Wheat Production and Stocks
The United States Department of Agriculture (USDA) publishes statistics and forecasts that help assess the outlook for the American and global grain market. For analyzing ZW, reports such as WASDE, Crop Progress, production data by wheat classes, and export shipment statistics are particularly useful.
WASDE Report
The monthly World Agricultural Supply and Demand Estimates (WASDE) report contains estimates of production, consumption, international trade, and ending stocks of wheat. Changes in forecasts can influence quotations, especially when new values significantly differ from market expectations.
For ZW, it is important to compare the overall US wheat balance with data on individual classes. For example, an increase in hard wheat production does not necessarily fully offset a reduction in SRW harvest, as demand and technological characteristics of these categories differ.
Crop Progress Reports
USDA Crop Progress reflects the progress of agricultural work and crop conditions in the US. Depending on the season, data is published on sowing, germination, plant development, harvest, and crop condition assessments.
When analyzing ZW, it is necessary to consider not only national indicators but also the situation in states where SRW is grown. Changes in the condition of American winter wheat as a whole do not always equally reflect the prospects of all its classes.
How the Wheat Balance is Calculated
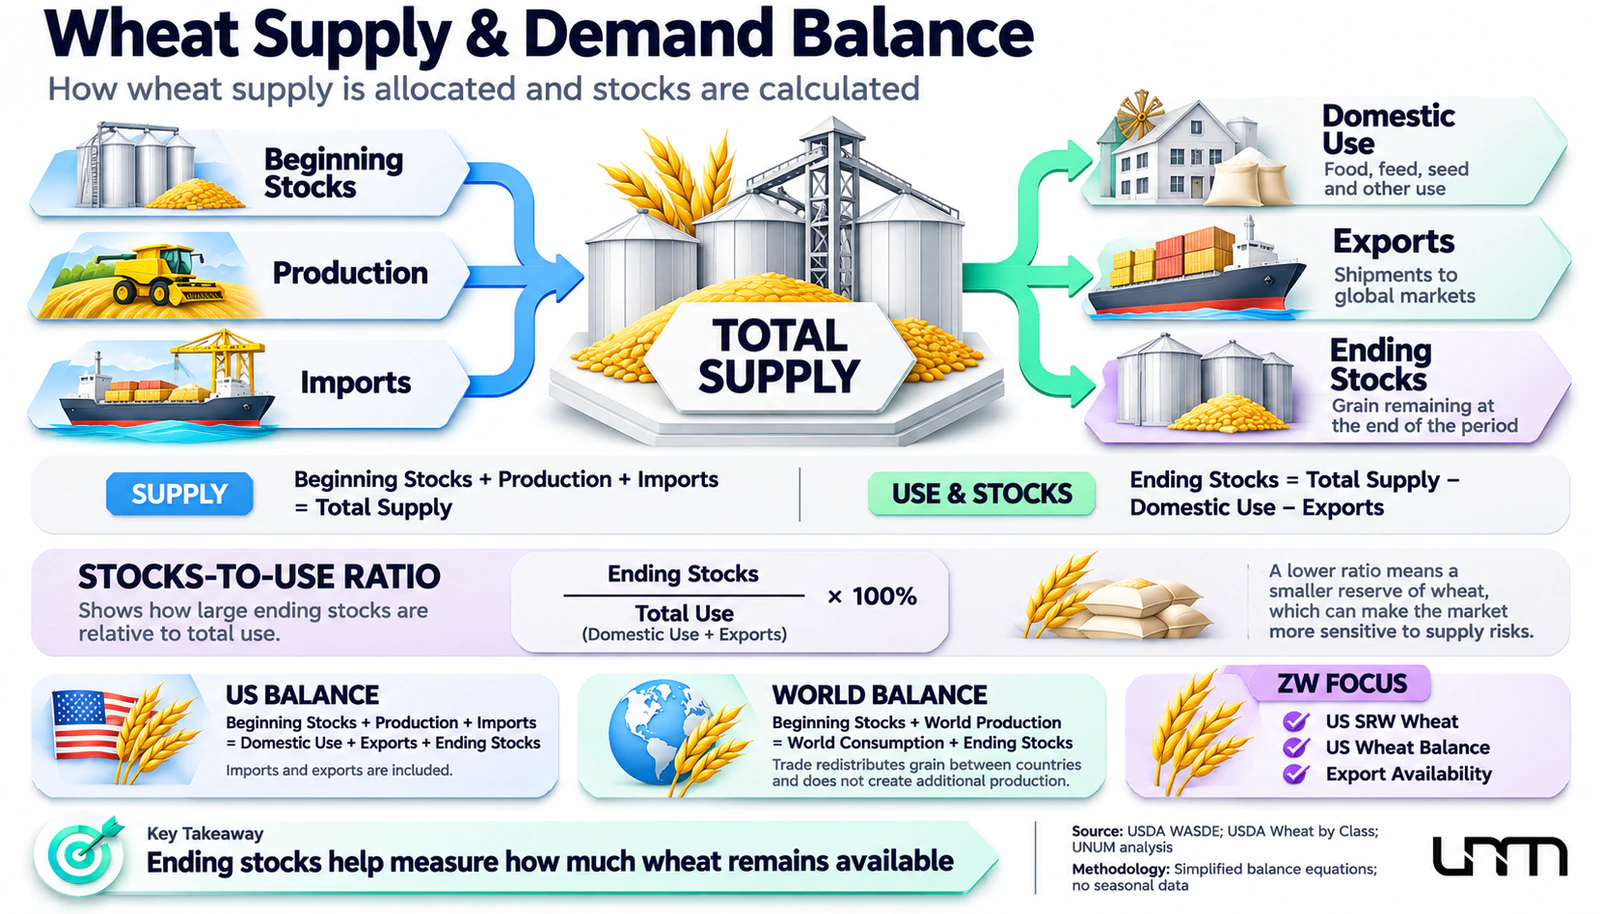
The supply and use balance shows how much grain is available during the marketing year and for what purposes it is directed. For a particular country, supply consists of beginning stocks, production, and imports, while use includes domestic consumption and exports.
Ending Stocks = Beginning Stocks + Production + Imports − Domestic Use − Exports.
To assess market sufficiency, the stocks-to-use ratio is used. In US balances, it typically reflects the ratio of ending stocks to total use, including domestic consumption and exports. When comparing with international indicators, it is necessary to consider differences in calculation methods.
A reduction in stocks relative to use can increase market sensitivity to unfavorable harvest forecasts. However, the volume of global stocks should be assessed considering their location and availability for international trade: not all grain accumulated in producing countries is potentially available to buyers on the external market.
How to Analyze the ZW Wheat Chart
To analyze ZW quotations, it is necessary to consider which specific contract is displayed on the chart. Individual futures have specific delivery months, while a continuous chart combines successive contracts according to the data provider's rules. Price gaps or historical series adjustments may occur during transitions, affecting trend interpretation.
Fundamental Analysis
Fundamental analysis of ZW is based on comparing the condition of the US crop with the global wheat balance. Primarily, the planted area and yield of SRW, weather forecasts, US ending stocks, USDA data, and the export competitiveness of American grain are evaluated. Then, actual figures are compared with previous estimates and market participants' expectations.
The wheat price forecast should not rely on a single indicator. For example, a reduction in the US crop can support ZW, but the impact may be limited if other exporters increase supply or buyers reduce purchases.
Futures Curve and Seasonal Spreads
ZW contracts with different expiration dates can trade at different prices. When longer-term futures are more expensive than nearby ones, the market is in contango. The reverse structure, where nearby contracts are more expensive than later ones, is called backwardation.
In the grain market, the difference between terms can reflect storage and financing costs, supply seasonality, and current grain availability. However, the futures curve is not a guaranteed forecast of the future physical price of wheat, so it should be analyzed alongside inventories and demand conditions.
Technical Analysis
Technical analysis involves studying price trends, support and resistance levels, moving averages, trading volume, and open interest. These indicators help assess market participant activity and the nature of price movements but do not guarantee forecast accuracy.
Special attention should be paid to periods of USDA report releases and changes in weather forecasts. New fundamental data can cause sharp movements in ZW, which are not always predictable based on historical charts.
What Instruments Are Used for Trading Wheat
In addition to the standard ZW futures, market participants have access to options on wheat futures, individual exchange-traded products, and CFDs. These instruments differ in calculation mechanisms, capital requirements, and risk characteristics.
Futures and Options
The ZW futures contract is used to open positions for price increases and decreases, as well as for hedging price risks for producers, exporters, and processors. Since the contract provides for physical delivery, a participant not planning to receive or deliver grain must consider expiration dates and close or roll over the position in advance.
Options on futures allow for strategies with different risk-reward ratios. The option buyer risks the paid premium, while the seller's obligations depend on the position structure and collateral used.
CFD on Wheat
A CFD is an over-the-counter contract for price differences, allowing trading on wheat price changes without acquiring physical grain. However, the underlying price reference and settlement terms are determined by the broker. Therefore, before trading, it is necessary to check whether a specific CFD is linked to ZW or another wheat contract.
Consider a hypothetical position equivalent to 1,000 bushels of wheat at $6 per bushel. Its nominal value is $6,000. If the broker allows a leverage of 1:10, the initial margin will be $600, and a 5% price change, or $0.30 per bushel, will result in a profit or loss of $300 before expenses.
The example demonstrates the impact of leverage, not the conditions of a specific broker. Actual CFD volumes, available leverage, spreads, rollover costs, and trading restrictions depend on the instrument and jurisdiction.
Exchange-Traded Products and Agricultural Company Stocks
In certain markets, investment products linked to wheat futures or baskets of agricultural commodities are available. Their returns may differ from changes in the nearest ZW contract due to fees, asset structure, and rollovers between futures.
Shares of fertilizer producers, agricultural machinery manufacturers, grain traders, and processors provide an indirect dependency on the agricultural market's condition but do not directly mirror wheat prices. The value of such companies is influenced by corporate results, production costs, debt load, and other factors.
Key Risks of Trading Wheat ZW
Agricultural futures are sensitive to weather conditions, seasonal supply changes, USDA reports, and international trade. Even with stable food demand, prices may decline due to high yields, increased inventories, or intensified export competition.
For traders, sharp price movements following forecast releases, differences between expiration dates, margin requirements, and the risk of physical delivery are of particular importance. When using leverage, losses can quickly exceed the initial margin, and additional obligations depend on the instrument's terms and applicable rules.
Frequently asked questions about Wheat ZW (ZW)
ZW is the ticker symbol for the Chicago Soft Red Winter Wheat futures on the CBOT. It is used for trading contracts on wheat with specific expiration dates.
The primary delivery class is No. 2 Soft Red Winter Wheat. Exchange rules also allow for the delivery of some other classes of grain under specific conditions and price adjustments.
On the CBOT, wheat ZW is quoted in cents per bushel. One bushel of wheat in standard calculations corresponds to 60 pounds, or approximately 27.22 kg.
The price is influenced by the harvest and condition of SRW crops in the US, global wheat stocks, export competition, weather conditions, and market participants' expectations.
Reports such as WASDE, Crop Progress, production data by wheat classes, and US export statistics are particularly important.
Contracts reflect different categories of grain, currencies, and delivery conditions. Prices are influenced by wheat quality, regional demand, logistics, and international competition.
Yes. Futures can usually be closed before delivery obligations arise. Options and individual CFDs are also available if offered by the broker and permitted in the relevant jurisdiction.
If a continuous futures series is used, gaps may occur when transitioning between contracts with different expiration dates. Therefore, the method of chart construction must be considered for analysis.