


Market performance as the week concludes
In the previous UNUM issue, the key question was how much the high cost of capital is starting to constrain economic activity. Events from October 19–22 showed that investors are increasingly evaluating not only inflation but also the financial stability of companies, especially in the tech sector.
The most telling was the behavior of US stocks on October 22. The Nasdaq Composite fell by 2.6%, the S&P 500 lost 1.2%, while the Dow Jones barely changed, adding less than 0.1%. This dynamic indicates that the pressure was primarily concentrated in the tech sector rather than evenly distributed across the entire stock market. Simultaneously, the yield on ten-year US Treasuries fell by 19.3 basis points to 4.953%, amid increased demand for safe-haven assets.
Particularly important were the results of Meta for Q3. The company's revenue grew by 26% year-over-year to $64.6 billion, but capital expenditures, including the repayment of principal lease obligations, reached $34.91 billion, and free cash flow was negative at minus $2.12 billion.
Operating profit decreased by 37% to $12.99 billion, mainly due to a one-time legal charge of $9.89 billion. Excluding this expense, the figure would have been $22.88 billion, up approximately 11% year-over-year. Thus, Meta's operating results were significantly stronger than the overall profit figure suggests, although the high capital intensity of AI investments continues to impact cash flow.
Additional pressure was created by oil. At the end of trading on October 22, Brent rose by 4% to $113.17 per barrel, amid new attacks on Saudi Arabia's energy infrastructure and concerns about supply disruptions from the Middle East.
The main result of the week is a change in the market balance of risks. Inflationary pressure persists, but at the same time, doubts about the sustainability of corporate profits and economic growth are intensifying. This contradiction will be decisive for the next trading week.
Fed rate decision to shape investor expectations
On October 28, the Federal Reserve will conclude a two-day FOMC meeting. After the September hike of 25 basis points, the target range for the federal funds rate is 3.75–4.00%, while inflation remains significantly above the 2% target level.
According to the Bureau of Economic Analysis, in August, the Personal Consumption Expenditures (PCE) price index rose by 3.4% year-over-year, and the core index excluding food and energy increased by 3.0%. September's consumer and producer price statistics also indicated heightened inflationary pressure, limiting the room for monetary policy easing.
However, markets are simultaneously receiving opposing signals. The sharp decline in US Treasury yields and the sell-off of tech stocks indicate increased concern over economic growth prospects. Therefore, investors will assess which risk the Fed considers more significant — maintaining high inflation or excessive economic slowdown.
In its September statement, the regulator outlined its position as follows:
Inflation remains elevated. Today's monetary policy decision will contribute to a more timely return of inflation to the Committee's 2% target level.
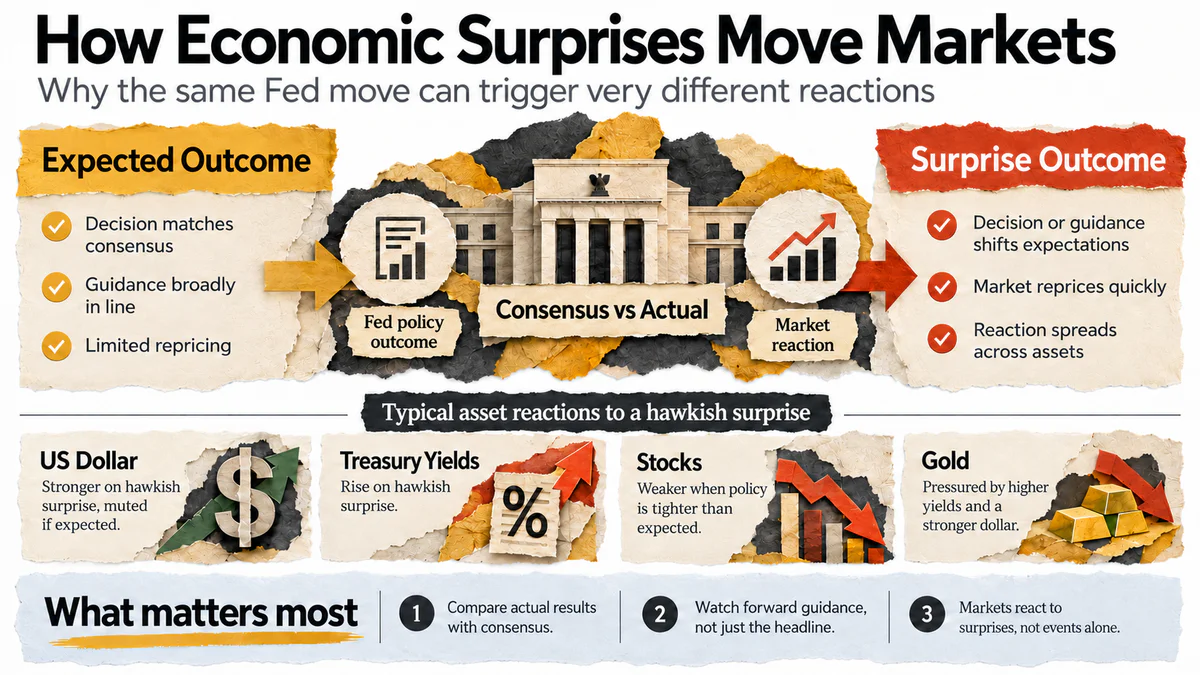
For traders, the decision itself and its divergence from market consensus are of fundamental importance. Even maintaining the rate can cause significant movement in currencies, bonds, and stocks if the regulator changes its assessment of the future trajectory of monetary policy.
Three main scenarios are possible:
Strong signal. The Fed emphasizes the need to maintain restrictive policy for an extended period or allows for further rate hikes. All else being equal, this could support the dollar and short-term Treasury yields while increasing pressure on the Nasdaq and other rate-sensitive assets.
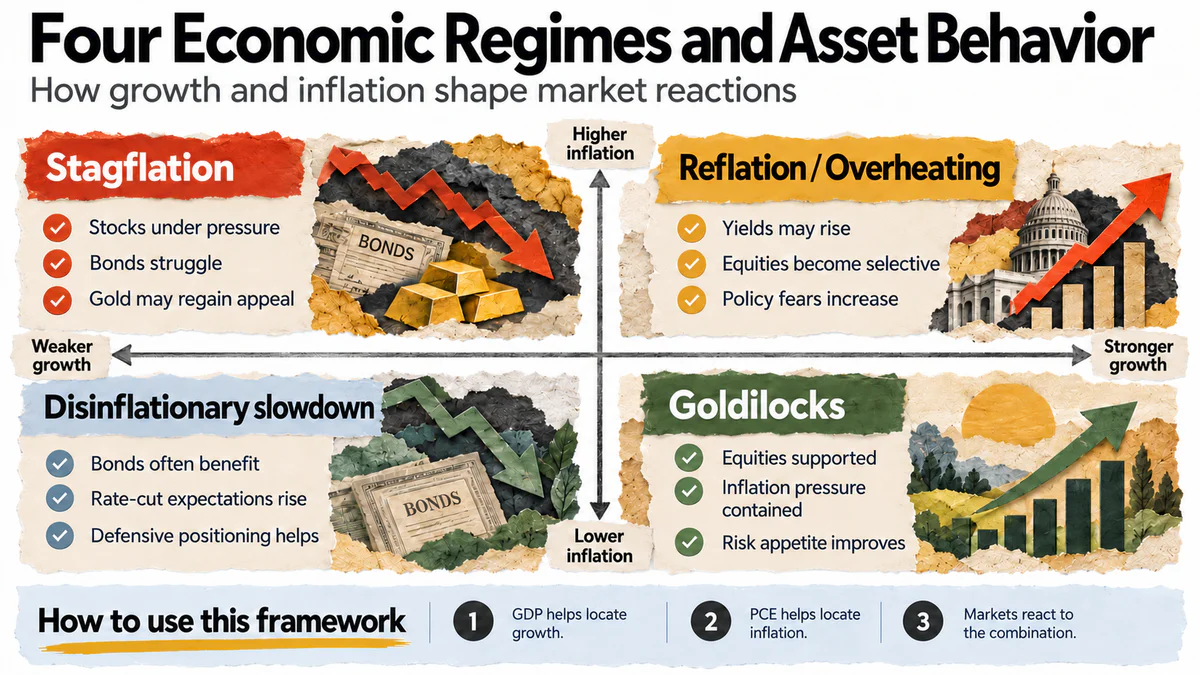
Neutral signal. The decision and comments align with investor expectations. In this case, the main focus will shift to the release of GDP and PCE inflation on October 29.
Softer signal. The regulator places more emphasis on the risks of economic slowdown. Bond yields may decline, but the reaction of stocks will depend on whether investors perceive the statement as a precursor to future policy easing or a warning of deteriorating economic growth.
The first benchmark will be the two-year US Treasury bonds, which are most sensitive to Fed rate expectations. Then it's important to compare the dynamics of DXY, S&P 500, Nasdaq 100, and Bitcoin.
Simultaneous declines in yields and stocks may indicate growing concerns about the economy, but to confirm such an interpretation, it's also necessary to assess credit spreads, dollar movements, and the nature of published economic data.
Infographics
US GDP and PCE inflation to test economic resilience
On October 29, the day after the Fed meeting, the US Bureau of Economic Analysis will release the first estimate of US GDP for the third quarter and September statistics on income, consumer spending, and PCE inflation.
In Q2 2026, real GDP grew by 2.2% annually after a 2.5% increase in Q1. The economy continued to expand, but the growth rate slightly slowed. Meanwhile, in August, real consumer spending increased by 0.6% month-over-month, while real disposable income remained unchanged, and the personal savings rate was 4.1%.
These figures raise a more substantial question than merely assessing the quarterly GDP growth. How resilient is the American consumer if spending is increasing faster than real income, and high inflation continues to limit purchasing power?
Three components are particularly important for evaluating the new data:
GDP structure. Growth in consumption and private investment indicates sustained domestic demand, while a high contribution from inventory accumulation or a reduction in imports may create a less favorable picture of economic growth quality.
Core PCE. Monthly dynamics of the index excluding food and energy will help assess how much price pressure is spreading beyond the energy sector.
Real consumer spending. Comparing it with income and savings will show how capable households are of maintaining the current level of consumption.
On October 30, the US Bureau of Labor Statistics (BLS) will release the Employment Cost Index (ECI) for Q3. The indicator reflects changes in employer costs for wages and benefits. In Q2, they increased by 0.9% compared to the previous quarter and by 3.4% year-over-year.
For the stock market, the most favorable combination could be sustained economic growth and a slowdown in core inflation. Conversely, strong GDP coupled with accelerating PCE could heighten expectations for prolonged high rates, which is particularly sensitive for tech companies with high market multiples.
Weak growth amid persistent inflation will present a more challenging scenario. In this case, investors will face both deteriorating corporate profit prospects and limited opportunities for the Fed to support economic activity.
ECB and Bank of Japan decisions to highlight differences in global rate policies
On October 29, the European Central Bank will make its rate decision. After the September hike, the ECB's deposit rate stands at 2.50%, while the annual inflation rate in the eurozone accelerated from 3.2% in August to 3.8% in September.
According to Eurostat, the energy component contributed 1.71 percentage points to annual inflation, and services added another 1.52 points. This means the regulator has to consider both the direct rise in energy prices and internal price pressures, which do not automatically disappear with the stabilization of oil prices.
The previous meeting highlighted the dependence of further decisions on incoming statistics:
“We are not pre-committing to a particular rate path.”
We do not commit to any specific trajectory for interest rates.
Christine Lagarde, President of the ECB, press conference on September 10, 2026
For European investors, the key will be how the ECB balances inflation risks with the rising cost of government borrowing. Amid fiscal uncertainty in certain eurozone countries, the yield spread between French and German bonds remains an indicator of tension in the debt market.
On October 30, Eurostat will also release a preliminary estimate of the eurozone GDP for Q3. The new data will allow for an assessment of how tighter financial conditions are impacting real economic activity.
Key benchmarks for Europe include EUR/USD, German Bund yields, the French OAT to Bund spread, and the Euro Stoxx 50. If the ECB maintains a hawkish stance amid weak economic growth, euro appreciation may not necessarily be accompanied by a rise in European stock indices.
In Japan, the situation is different. After the September hike, the Bank of Japan's rate reached 1.25%, while core consumer inflation in September was 2.1% year-on-year. The measure excluding fresh food and energy reached 2.4%.
On October 30, the regulator will present its rate decision and an updated forecast for economic activity and prices. Investors will assess how sustainable domestic inflationary pressure is, allowing for continued monetary policy normalization.
For international markets, the yen's exchange rate is not the only concern. Rising yields on Japanese Government Bonds (JGB) could increase the attractiveness of domestic investments; however, the decision to repatriate capital depends on yield differentials, currency hedging costs, and investment restrictions. Therefore, alongside USD/JPY, it is essential to monitor Japanese bonds and the interest rate differential dynamics between the US and Japan.
On October 28, the Bank of Canada will also hold a meeting, where the current rate is 2.25%. The most interest will be in the updated economic forecast, the reaction of USD/CAD, and the assessment of the impact of high energy prices on inflation and domestic demand.
Collectively, the decisions of major central banks will show how monetary conditions differ across developed economies. For the foreign exchange market, the divergence in expectations regarding future rates is often more important than the absolute level of a country's rate.
Earnings Reports from Microsoft, Alphabet, and Amazon to Test AI Investment Returns
The second half of the week will be one of the key stages of the corporate earnings season. On October 28, Microsoft and Alphabet will release their results, on October 29, — Amazon. For investors, these publications will test how quickly large-scale investments in artificial intelligence are turning into sustainable revenue, corporate profits, and free cash flow.
In the UNUM study on AI investments and debt risks, differences between equipment manufacturers, cloud platforms, and data center operators were already examined. Now, the quarterly reports will allow for an assessment of the investment programs of the largest buyers of computing infrastructure.
After Meta's results, the question of return on investment has become particularly relevant. Despite a negative free cash flow for the quarter, the company's management remains confident in its chosen strategy:
Our investments are paying off, the core business remains strong, and we are seeing acceleration across all fronts.
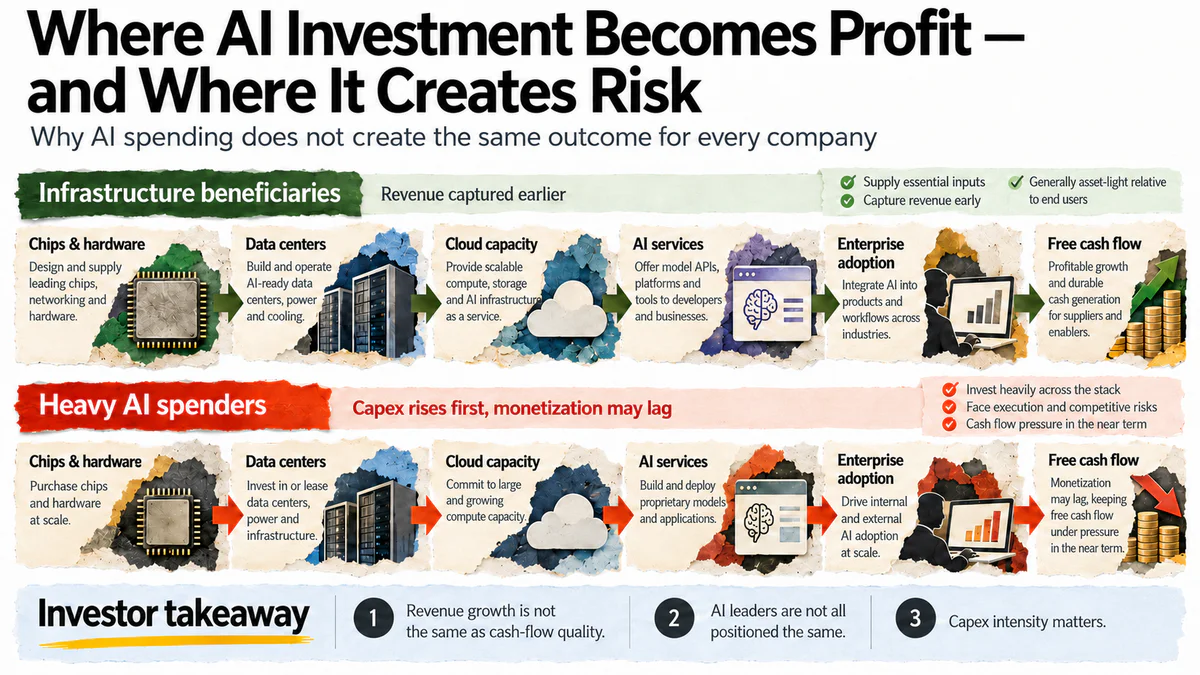
However, high revenue and management confidence alone do not resolve the issue of cash expenditures. For investors, it is crucial to distinguish between business growth, accounting profit, and actual cash flow.
Microsoft. The main indicator will be the dynamics of Azure and other cloud services. In addition to revenue growth, it is necessary to assess capital expenditures (CapEx), operating margin, and management forecasts regarding the utilization of new computing capacities. Strong Azure results with unexpectedly rapid expense growth could trigger a mixed reaction in the stock.
Alphabet. The focus will be on Google Cloud, the advertising business, and the economic implications of AI search development. Investors need to understand how cloud revenue offsets rising investments and whether the traditional search business retains its ability to generate high margins.
Amazon. A key metric will be AWS, whose revenue in Q2 grew by 37% year-over-year to $42.2 billion. This was the fastest growth rate for the cloud division in 18 quarters. It is now necessary to compare the new results with AWS's operating profit, capital expenditures, and the company's overall free cash flow.
The main risk for the technology sector is not necessarily a weakening demand for artificial intelligence. Even with continued growth in orders, investors may reassess the business valuation if the expected payback period for data centers increases or if the capital expenditure forecast again exceeds market consensus.
For short-term market reaction, not only the actual quarterly results but also forecasts for the next period will be of particular importance. If companies confirm high demand, maintain profitability, and controlled CapEx growth, this could support the Nasdaq 100 and semiconductor manufacturers. If expenses continue to grow faster than cash flows, pressure on high-multiplier tech stocks may persist even after exceeding revenue expectations.
China and oil will continue to influence global risks
After the publication of China's Q3 GDP, investor attention will shift from overall growth rates to corporate financial results. The Chinese economy grew by 4.5% year-over-year after 4.3% in Q2, but fixed asset investments from January to September decreased by 7.2% year-over-year, including real estate development investments by 20.6%.
On October 27, the publication of the total profits of large industrial enterprises in China for January to September is expected. For the first eight months, the figure grew by 15.7% year-over-year, although the annual growth rate of monthly profits slowed to 4.2% in August.
These data will help assess how much industrial production growth is accompanied by improved corporate financial results. The resilience of export and high-tech manufacturing may support overall figures, but weak domestic demand, real estate issues, and rising costs continue to limit profitability in certain sectors.
For global investors, the reaction of Chinese stock indices, the yuan, copper, and iron ore is important. Improvement in industrial profits without a recovery in domestic demand will not necessarily lead to sustainable growth in the entire Chinese market.
Another important factor for global markets is the cost of energy. After Brent rose above $113 per barrel, investors are particularly sensitive to reports on the security of Saudi Arabia's oil infrastructure and routes through the Strait of Hormuz and Bab-el-Mandeb.
It is necessary to distinguish between geopolitical premium and actual supply reduction. Concerns about potential disruptions can quickly raise prices, but the duration of the oil shock will depend on actual supply volumes, reserves, refining capacities, and transportation availability.
On October 30, ExxonMobil will release its quarterly report, which will complement the picture with the state of the largest energy companies. However, global inflation expectations will be more affected not by the profit of a single producer, but by how long oil remains expensive and how quickly the rise in fuel costs translates into transportation tariffs, goods, and services prices.
The mechanism of transmitting the oil shock to financial markets is detailed in UNUM's analysis on the impact of expensive oil on Bitcoin. The main correlation remains the same: high energy prices intensify inflation expectations and limit central banks' ability to reduce the cost of borrowing.
Bitcoin and Coinbase will test investors' risk appetite
For the cryptocurrency market, the main external events will be the Fed's decision, new US inflation data, and tech companies' reports. An additional industry benchmark will be Coinbase's Q3 report, scheduled for October 29 after the US stock market closes.
Coinbase's results will allow assessing the state of trading activity, commission revenue, and other areas of cryptocurrency infrastructure. However, the performance of a single exchange cannot be automatically applied to the entire market, as changes in trading structure, fees, and client base can affect financial results independently of Bitcoin's price.
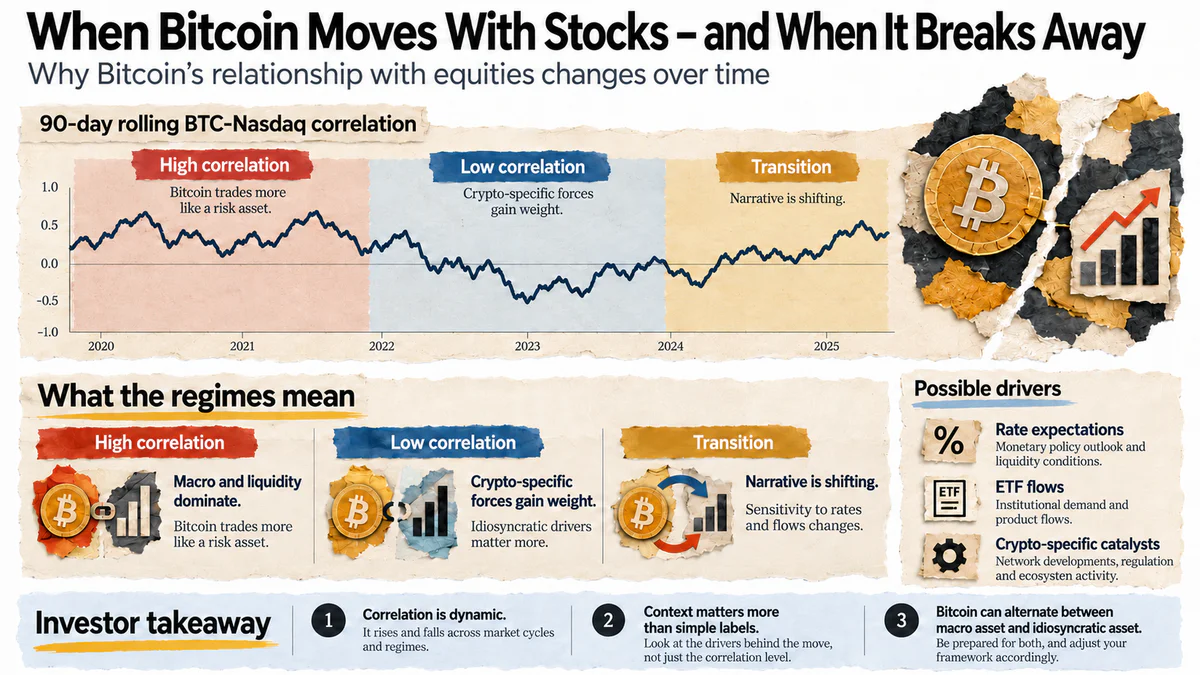
The most interesting question of the week is whether BTC will continue to move with tech stocks or show relative resilience.
For this, it is necessary to compare BTC/USD and Nasdaq 100 with several additional indicators:
Capital flows into spot Bitcoin ETFs. These allow for assessing net inflows and outflows through regulated exchange-traded funds, although they do not reflect the entire institutional demand for Bitcoin.
Open interest and funding rates on perpetual futures. These help determine whether a price change is accompanied by leverage accumulation and an increased risk of forced position closures.
DXY and US Treasury yields. These reflect changes in expectations regarding monetary policy, the cost of capital, and the attractiveness of dollar assets.
Previously, UNUM analyzed Bitcoin's recovery and demand resilience after the October sell-off. In the coming week, it will be more important to assess not just a single day of inflows into Bitcoin ETFs, but the sustainability of capital flows after the Fed meeting.
If the Nasdaq declines simultaneously with BTC, and leverage and open interest decrease, this may indicate a general deterioration in investors' risk appetite. However, if Bitcoin remains stable amid weak stocks and consistent ETF inflows, factors specific to the cryptocurrency market may become more significant.
However, short-term correlation does not guarantee similar asset behavior in the future. Therefore, Bitcoin's forecast for the week should consider monetary conditions, spot demand, liquidity, and the structure of positions in the derivatives market.
Market Guidelines for the Week
The financial market forecast for the week primarily depends on the divergence between expectations and central bank decisions, as well as the actual results of major companies. To distinguish changes in fundamental expectations from short-term volatility, investors should observe combinations of indicators rather than individual quotes.
Key indicators:
US Treasury 2Y — changes in Fed rate expectations after the meeting and PCE publication.
US Treasury 10Y — balance of inflation risks, economic growth expectations, and demand for safe-haven assets.
DXY — dollar's reaction to differences in monetary policy of major central banks.
Nasdaq 100 — reassessment of AI investments, results of tech giants, and future corporate profits.
Brent — changes in the geopolitical premium in energy prices.
USD/JPY — currency market's reaction to the Bank of Japan's decision.
BTC/USD — relative stability of the cryptocurrency market amid changes in investors' risk appetite.
The most indicative will be the combination of Treasury yields and stock indices dynamics. A decline in yields along with rising stocks may indicate expectations of a more accommodative policy, whereas simultaneous declines in yields and stocks often accompany increased economic concerns. To confirm the interpretation, it is necessary to additionally consider the dollar, credit spreads, and actual economic indicators.
Three Main Questions of the Week
1. Will central bank decisions be more stringent than investors expect?
The Fed, ECB, and Bank of Japan face different economic conditions, but their decisions affect the global cost of capital. Even without unexpected rate changes, revised forecasts and rhetoric can alter the dynamics of currencies, bonds, and stocks.
2. Can tech companies confirm the profitability of AI investments?
The results of Microsoft, Alphabet, and Amazon will show to what extent cloud service growth is accompanied by increased profitability and cash flow. For Nasdaq and semiconductor manufacturers, capital expenditure forecasts may be as important as quarterly earnings.
3. What will be the main driver of financial markets — inflation or slowing growth?
If US GDP confirms a resilient economy amid slowing PCE, investors will have arguments for a more favorable scenario. However, sustained high inflation alongside weakening activity will increase uncertainty and may heighten volatility across multiple asset classes.
Economic Calendar for the Week of October 26–30
Time is indicated in Central European Winter Time (CET, UTC+1). Europe will switch to winter time on October 25, and the US on November 1, so this week the time difference between New York and Central Europe will be five hours.
Key dates are published in the official calendars of the Federal Reserve, ECB, Bank of Japan, Bank of Canada, BEA, BLS, Eurostat, and on company websites. The schedule for individual corporate publications and regulator decisions may be subject to change.
The week of October 26–30 could be a crucial stage in reassessing expectations regarding the global economy. Central bank decisions will indicate how long the cost of borrowing will remain high, U.S. statistics will allow for an assessment of economic growth resilience, and the earnings reports of tech giants will test the financial foundation of the AI boom.
For investors, the main focus will not be on individual values of rates, inflation, or corporate profits, but on the coherence of incoming signals. It is the combination of economic data, company forecasts, and the reaction of bond, currency, and stock markets that will determine whether the foundation for further asset growth is strengthening or if financial conditions are increasingly constraining it.