


How global markets are ending the week
In the previous UNUM issue on events from November 2–6, attention was focused on the US labor market, midterm congressional elections, and corporate earnings. However, one of the main events of the past week was the massive sell-off of tech stocks, which forced investors to reassess risks associated with artificial intelligence and future corporate profits.
On November 5, the Nasdaq Composite fell by 5.52%, the S&P 500 lost 4.36%, and the Dow Jones dropped 3.44%. For the Nasdaq, this was the most significant one-day drop in the last 19 months. Semiconductor manufacturers and companies involved in building data centers saw particularly sharp declines. The SOX index, reflecting the dynamics of the US semiconductor sector, lost more than 12%.
The sell-off occurred after the US midterm elections, in which the Democratic Party gained control of both houses of Congress. As reported by Reuters, market participants cited concerns over potential AI regulation tightening and data center construction restrictions as pressure factors. However, specific legislative outcomes of the elections remain undefined, and the political factor does not explain the entire decline. High valuations of tech companies, significant capital expenditures, and uncertainty about the payback period of AI infrastructure also heightened investor caution.
Meanwhile, the fundamental indicators of individual companies remained strong. AMD reported a 45% increase in quarterly revenue to $13.4 billion, with data center segment revenues up 97% to $8.5 billion. These results confirm high demand for computing equipment but do not eliminate questions about financing costs and the profitability of further AI infrastructure expansion.
Additional signals came from central banks. On November 5, the Bank of England raised the key rate by 25 basis points to 4% amid persistent inflationary pressures. The regulator expects UK inflation to approach 5% by mid-2027. The Reserve Bank of Australia also continued tightening monetary policy, raising the rate to 4.85%.
On commodity markets, the situation developed differently. On the morning of November 6, Brent was trading around $99.6 per barrel, heading for a significant weekly decline. The drop in oil prices was accompanied by expectations of a possible de-escalation of the Middle East conflict, but the actual recovery of supplies remained uncertain.
As a result, global markets approach the new week with mixed signals. The decline in oil prices potentially eases future inflationary risks, but expensive money and doubts about the payback of AI investments continue to limit demand for risky assets. The next test will be October's US inflation.
US inflation to determine Fed rate expectations
On November 10, the US Bureau of Labor Statistics (BLS) will release the October Consumer Price Index (CPI), and on November 13, the Producer Price Index (PPI). US inflation for October 2026 will be the main macroeconomic indicator of the week, as new figures will allow assessing the resilience of price pressures ahead of the December Federal Reserve meeting.
In September, US consumer inflation accelerated to 3.7% year-on-year from 3.4% in August. The CPI rose by 0.6% over the month, with more than half of the increase driven by a 9.1% rise in gasoline prices. The energy component overall increased by 5.2% for the month and 20.4% year-on-year.
Core CPI, excluding food and energy, rose by 0.3% for the month and 2.6% year-on-year. This difference between overall and core inflation shows the significant role energy played in the September price acceleration.
The October report will determine how retail gasoline prices changed during October and how persistent pressure remained in other categories. However, the sharp drop in Brent in early November is not directly included in the October CPI. Its potential impact on consumer prices will manifest in subsequent reporting periods and will depend on the dynamics of retail fuel prices.
Three components are of particular importance:
Energy carriers. The dynamics of gasoline and fuel will show the energy sector's contribution to the overall CPI. However, a decrease in energy prices does not guarantee a comparable slowdown in core inflation.
Housing and services. Monthly changes in these components will help assess the sustainability of domestic price pressure, which depends on consumer demand, wages, and operating expenses.
Core goods. Their dynamics will allow determining how changes in procurement and import prices are reflected in the cost of final products.
On Friday, the picture will be complemented by the PPI index. In September, producer prices for final demand rose by 1.3% for the month and by 6.3% year-on-year, marking the highest annual rate since December 2022. Goods for final demand increased significantly by 2.6% for the month, mainly due to the energy component.
Unlike the CPI, which reflects changes in consumer prices, the PPI measures the dynamics of wholesale prices of American producers and service providers. It allows for the assessment of price conditions at different stages of production and distribution but is not a direct measure of all enterprise costs.
For analyzing sustainable price pressure, it is useful to consider not only the overall PPI but also the index excluding food, energy, and trade services. In September, it rose by 0.5% for the month and by 5.0% year-on-year. This approach helps partially separate changes in individual volatile components from broader price trends.
For traders, the deviation of actual results from market consensus is particularly important. Even a slowdown in the CPI can trigger a negative reaction if inflation decreases less than analysts expect.
Three main scenarios are possible:
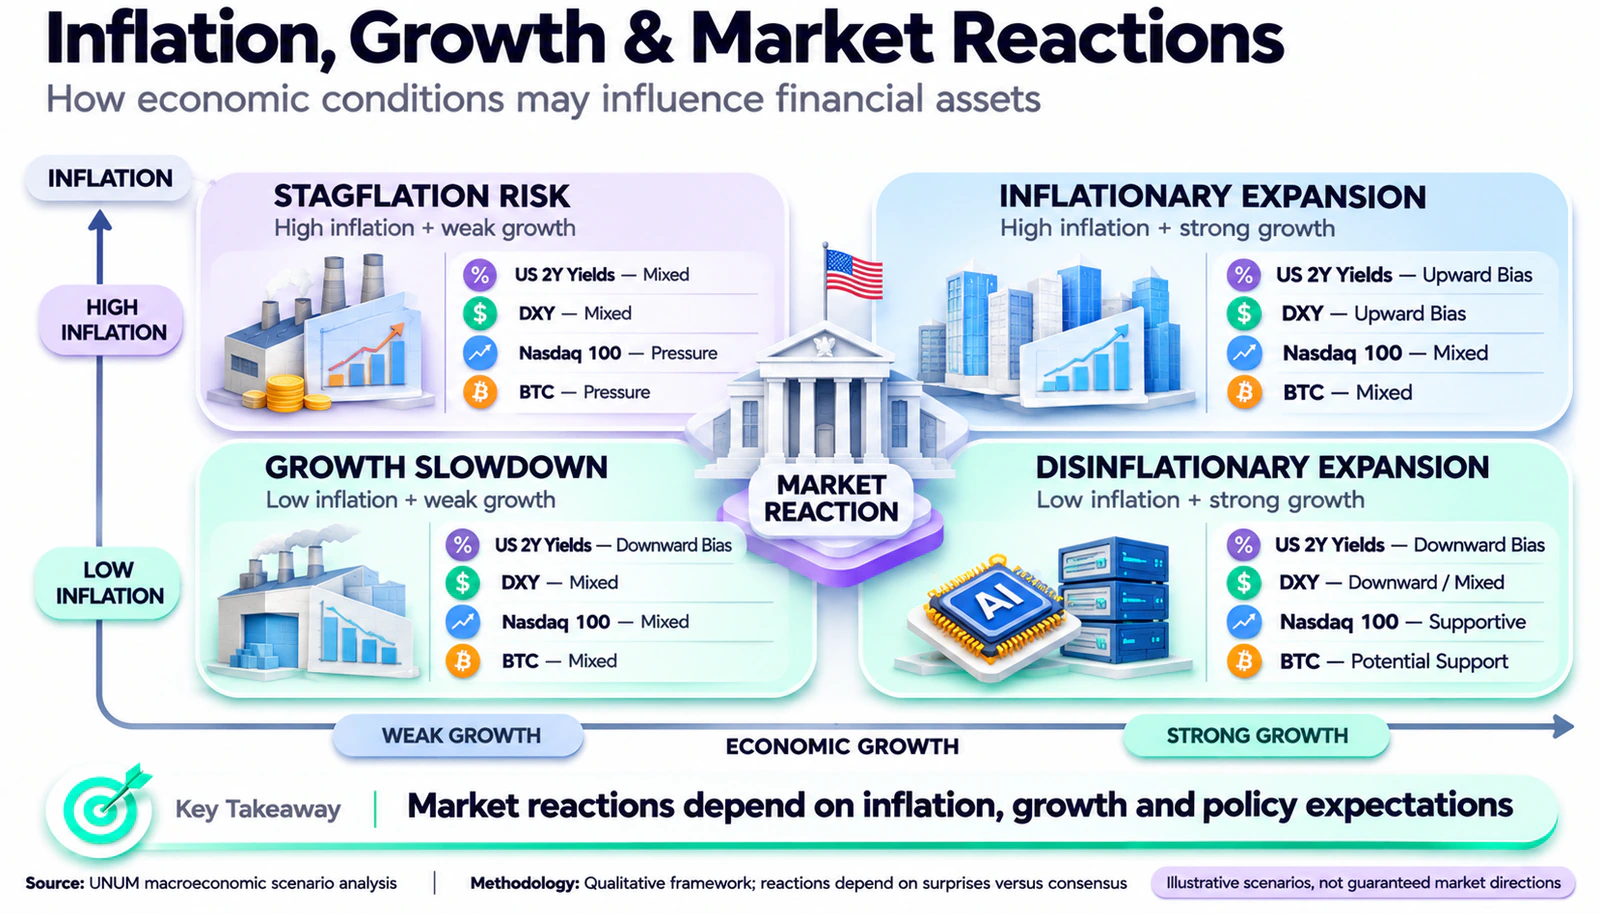
Inflation above expectations. An acceleration in core CPI and sustained high PPI may heighten expectations of prolonged tight monetary policy. All else being equal, this will support the dollar and short-term US Treasuries yields, while putting pressure on Nasdaq and other rate-sensitive assets.
Inflation meets forecasts. The reaction may be limited if the structure of the indicators also does not bring surprises. In this case, market participants' attention will shift to corporate reporting and other macroeconomic publications.
Inflation below consensus. A slowdown in core prices can support government bonds and the stock market by lowering expectations of future rates. However, the sustainability of stock growth will depend on whether disinflation is accompanied by a deterioration in economic activity.
The Fed's rate decision in December will depend on the aggregate of incoming data, and the October CPI and PPI will help investors reassess expectations of further monetary policy.
The main indicators of reaction will be the yields of two-year US Treasury bonds, the DXY dollar index, and the Nasdaq 100. If bond yields decrease and stocks rise, the market may perceive the statistics as a signal of easing inflation risks. Simultaneous declines in yields and stocks, on the contrary, will require checking whether concerns about economic growth have intensified.
AI Companies' Earnings Reports to Test Investment Returns
After a massive sell-off of AI company stocks, investors will receive a new series of financial reports from participants in the technology industry. This time, the focus will be less on the largest cloud platforms and more on specialized data center operators, network equipment manufacturers, chip technology suppliers, and energy companies.
In UNUM's study on the economics of AI investments, it was already considered why the rapid growth in demand for computing power does not guarantee the same profitability for all industry participants. The new quarterly reports will allow checking how widely the revenues from the AI boom are distributed and which companies bear the greatest financial risks.
CoreWeave — November 10
The company provides specialized cloud capacities for training and running artificial intelligence models. Its Q3 report will be particularly important after the decline in quotes of AI infrastructure operators.
The main focus should be on revenue growth rates, computing capacity utilization, long-term contracts, and the cost of attracted capital. Building data centers requires significant investments, so rapid business growth may be accompanied by increased debt load and negative free cash flow.
To assess CoreWeave's results, it is important to compare the order portfolio with the timing of new capacity commissioning, capital expenditures, and the debt service schedule. Even large long-term contracts do not automatically determine how quickly investments will start generating positive cash flow.
Cisco — November 12
The network equipment manufacturer will present its results for the first quarter of the 2027 fiscal year. The main interest lies in the demand for high-speed network equipment for data centers, as the increase in computing power requires parallel development of data transmission infrastructure.
In the fourth quarter of the 2026 fiscal year, Cisco increased its revenue by 18% to $17.3 billion. For the entire fiscal year, the company received about $4 billion in revenue from AI infrastructure for large cloud clients. For the 2027 fiscal year, management forecasts an increase in this figure to approximately $7.5 billion.
For investors, it is important to understand whether the pace of order fulfillment is maintained and whether the increase in sales is accompanied by stable operating margins. Revenue growth from AI infrastructure can support the company's results, but its impact on profit depends on the cost of equipment, contract structure, and competition.
Applied Materials — November 12
The company will present its results for the fourth quarter and the entire 2026 fiscal year. Its equipment is used in the production of semiconductors, including advanced logic chips, DRAM, and NAND Flash.
Special attention should be paid to the investment plans of chip manufacturers, demand for equipment for advanced technological processes, and the development of chip packaging technologies. If semiconductor companies continue to expand production capacities, Applied Materials may receive additional support from orders.
However, the increase in demand for server components simultaneously creates risks for consumer electronics manufacturers. Rising memory prices can increase the cost of devices and put pressure on gross margins.
This mechanism is examined in detail in UNUM's analysis on DRAM, NAND prices, and Apple's margins.
Constellation Energy — November 9
The energy company's report will allow an assessment of another important element of the AI industry — the conditions of energy supply for data centers.
For operators of computing infrastructure, not only electricity tariffs are important, but also the availability of reliable generating capacities, the throughput of power grids, and the timing of connecting new facilities.
Constellation Energy's results will help assess the financial condition of the energy business and the prospects for long-term demand for electricity, although they do not by themselves determine the entire cost of energy supply for the American AI infrastructure.
Collectively, the reports from CoreWeave, Cisco, Applied Materials, and Constellation Energy will show how stable the financial results are across different links in the technology chain. To assess the prospects of AI company stocks, it is necessary to compare revenue growth with operating profitability, free cash flow, debt, and management forecasts.
The Nasdaq forecast will depend not only on strong or weak quarterly results but also on whether the financial indicators justify the high stock valuations and expectations of future profits.
China's producer and consumer prices will show demand conditions
On November 9, the National Bureau of Statistics of China will release consumer and producer price indices for October. For international investors, this data is important not only as an indicator of the state of the world's second-largest economy but also as a guide for global demand for raw materials, industrial equipment, and consumer goods.
In September, China's consumer inflation was 0.9% year-on-year, while the core CPI excluding food and energy rose by 1.0%. Meanwhile, food prices fell by 1.7%, whereas non-food prices increased by 1.5%.
The growth of the producer price index was significantly higher than consumer inflation. The PPI increased by 5.0% year-on-year, accelerating by 1.2 percentage points compared to August.
This discrepancy between CPI and PPI shows differences in price dynamics in the industrial and consumer segments of the economy. However, it does not in itself prove a reduction in enterprise profits, as the indices cover different sets of goods and services.
To assess profitability, it is necessary to additionally consider purchase prices, sales structure, and producer margins. In particular, China's industrial purchase price index in September rose by 6.9% year-on-year, indicating a significant increase in costs for goods and materials purchased by enterprises.
October data will help verify whether the gap between production and consumer inflation is narrowing. A slowdown in purchase prices amid stable demand could ease pressure on enterprise margins. But if the PPI decline is caused by a reduction in orders and a deterioration in economic activity, the consequences for the stock market may be less favorable.
For international investors, the reaction of the CSI 300, Hang Seng China Enterprises, USD/CNH, AUD/USD, copper, and iron ore is important. An improvement in industrial demand can support commodity assets, while weak consumption may increase doubts about the sustainability of China's recovery.
UK and Eurozone GDP data to test European economic resilience
On November 12, the UK Office for National Statistics (ONS) will publish the first estimate of GDP for the third quarter, data for September, and industrial production statistics.
The publication gains additional significance following the Bank of England's decision on November 5 to raise the rate to 4%. The regulator expects annual inflation to accelerate to around 5% by mid-2027, despite maintaining restrictive monetary conditions.
In an official statement, the Monetary Policy Committee noted:
However, the scale of the emerging inflationary pressure is now sufficient to justify an increase in the Bank of England's key rate.
New statistics will allow assessing how resilient the British economy remains under conditions of expensive financing and an energy shock.
Particular attention should be paid to the dynamics of services, industry, construction, and private investments. If growth is weaker than expected, investors may revise corporate profit prospects, even if high inflation continues to limit the Bank of England's ability to ease policy.
For the currency market, the reaction of GBP/USD and yields on UK government bonds (gilts) will be most important. Weak GDP could put pressure on the pound, but the final direction of the exchange rate will depend on how much the new data alters the expected interest rate differential between the UK and the US.
On November 13, Eurostat will present a revised estimate of the eurozone GDP for the third quarter and preliminary employment data.
According to the initial estimate, the eurozone economy grew by 0.4% compared to the previous quarter after a 0.6% increase in the second quarter. At the same time, preliminary inflation for October accelerated to 4.0% year-on-year from 3.8% in September. Particularly notable was the increase in energy prices — up 20.8% year-on-year.
This combination heightens the contradiction between fighting inflation and the need to support economic growth. If the revised GDP is weaker than the initial estimate, it could raise investor concerns about the state of European companies and public finances.
The main indicators will be EUR/USD, Euro Stoxx 50, German Bund yields, and employment figures. When assessing the reaction, it is important to consider not only the overall growth of the eurozone but also the differences between individual national economies.
An additional signal for Asian markets will come on November 12, when the Bank of Japan releases the corporate goods price index for October. It will help assess price pressures at the company level in Japan, where further normalization of interest rates also depends on the sustainability of inflation.
Oil market to test the resilience of price declines
After a sharp drop in oil prices in early November, investors will assess whether the global supply-demand balance is genuinely improving or if quotes primarily reflect a reduction in geopolitical premium.
On the morning of November 6, Brent was trading around $99.6 per barrel, and WTI around $91.4. Despite a short-term recovery, both grades were heading for a weekly decline of about 12%.
The decline in quotes was accompanied by expectations of a possible de-escalation of the Middle East conflict. However, reports of new attacks on tankers and ongoing risks to shipping show that the oil market remains sensitive to changes in the region's situation.
In UNUM's analysis on the decline in oil prices, differences between OPEC+ production quotas, actual exports, and geopolitical premium were already considered. In the new week, it is more important to verify whether the decline in Brent oil prices is confirmed by changes in the physical market.
To do this, investors should pay attention to several interrelated indicators:
Brent futures curve. If nearby contracts maintain a significant premium over more distant ones, it may indicate short-term supply balance tension even with an overall decline in oil prices.
Physical exports. The recovery of shipments through the Strait of Hormuz and alternative routes will be a more convincing confirmation of improved supply than isolated diplomatic statements.
Oil inventories and transportation costs. An increase in inventories along with a decrease in freight rates may indicate a gradual easing of tension.
For the stock market, a decline in oil prices could be a positive factor if it is accompanied by a weakening of inflation expectations and sustained demand. But if quotes fall due to deteriorating global economic prospects, cheaper energy resources will not necessarily support stocks.
Therefore, Brent needs to be compared with bond yields, DXY, and the dynamics of cyclical sectors of the stock market. Current prices are available in the commodities quotes section of UNUM.
[Infographic 3] How to distinguish a reduction in geopolitical premium in oil from a deterioration in global demand through the futures curve, inventories, export volumes, and transportation costs.
Bitcoin to Test Demand Resilience After Sell-off
The Bitcoin forecast for the week of November 9–13 will largely depend on the U.S. CPI and PPI data, dollar dynamics, and the resilience of spot demand. Changes in inflation expectations can affect the cost of capital and the attractiveness of risky assets, but Bitcoin's relationship with the stock market does not remain constant.
In early November, Bitcoin fell to approximately $75–76k after the October correction. The recovery in quotes raised questions about the demand structure and the role of leverage.
In the UNUM analysis on the role of futures in Bitcoin's recovery, Bitfinex's assessment was considered, according to which BTC's rebound in early November was predominantly supported by activity in the derivatives market. According to the data presented in the study, on November 3, open interest reached 701,548 BTC, the highest since September 22, while signs of a sustainable recovery in spot demand remained limited.
Additional pressure was created by outflows from American spot Bitcoin ETFs.
According to Farside Investors, the net capital outflow amounted to:
October 30 — $643.2 million.
November 2 — $398.6 million.
November 3 — $115.6 million.
The total outflow over three trading sessions reached $1.1574 billion. Meanwhile, on November 4, funds recorded an inflow of $74.6 million, but on November 5, there was a new outflow of $430.2 million.
Such dynamics do not allow for a statement about a sustainable recovery in demand through exchange-traded funds. At the same time, ETF flows reflect the operations of different categories of participants and do not allow for a direct determination of the behavior of institutional investors alone.
Next week, it is especially important to assess how Bitcoin will react to changes in expectations regarding Fed rates.
If the CPI is below market consensus, a decrease in Treasury yields and a weakening dollar could improve conditions for cryptocurrency recovery. However, the sustainability of such a movement will depend on the presence of real demand in the spot market.
If inflation exceeds forecasts, rising yields and strengthening DXY could increase pressure on BTC. This could be particularly noticeable with high leverage and increased funding rates for long futures positions.
To assess the situation, it is necessary to compare capital flows into Bitcoin ETFs, open interest, funding rates, and spot trading volumes. BTC growth accompanied by stable fund inflows and increased spot purchases will be a more convincing sign of demand recovery than a movement accompanied only by an expansion of futures positions.
At the same time, the correlation between Bitcoin and the Nasdaq 100 changes over time, so the same reaction of the two markets to U.S. inflation is not guaranteed.
Market Benchmarks of the Week
The financial market forecast for the week primarily depends on how much actual U.S. inflation and AI company results deviate from market expectations. For practical analysis, it is important to compare the dynamics of several asset classes rather than evaluating each indicator in isolation.
Key indicators:
US Treasury 2Y. Change in expectations for the December Fed decision following the release of CPI and PPI.
US Treasury 10Y. Balance of inflation risks, economic growth prospects, and demand for government bonds.
DXY. The short-term forecast for the dollar will depend on how much the new inflation data changes expectations for US interest rates compared to other major economies.
Nasdaq 100. Resilience of the tech sector after the sell-off and the release of new reports from AI infrastructure companies.
Brent. Change in geopolitical premium in oil quotes and the state of physical supplies.
BTC/USD. Reaction of the cryptocurrency market to the cost of capital, stock indices, and flows into spot Bitcoin ETFs.
It is difficult to determine prevailing market expectations based on a single indicator. For example, a decline in bond yields along with a rise in Nasdaq may reflect easing inflation risks, whereas simultaneous declines in yields and stocks could indicate growing concerns about economic growth.
For traders, a consistent assessment of reactions is useful: first compare published data with consensus, then check changes in interest rate expectations, yields, and the dollar, and only after that assess the movement of stocks and Bitcoin.
This approach helps distinguish short-term volatility from more significant asset revaluation, although it does not rule out false signals and ambiguous market reactions.
Three Main Questions of the Week
1. Will US inflation show a sustainable slowdown, or will the Fed have to maintain tight monetary policy?
The main benchmarks will be the monthly dynamics of core CPI, the structure of consumer prices, and the PPI index. It is the deviation of results from market consensus that can change expectations for rates, Treasury yields, and the direction of the dollar.
2. Can AI infrastructure companies confirm the profitability of large-scale investments?
Reports from CoreWeave, Cisco, Applied Materials, and Constellation Energy will allow assessing the financial results of various participants in the technology chain. For investors, not only revenue growth and order volume will matter, but also free cash flow, profitability, and debt load.
3. What will have a greater impact on global markets — a decline in oil prices or signs of economic slowdown?
New indicators from China, the UK, and the Eurozone will help determine whether the decrease in energy prices is accompanied by sustained demand. This combination will be significant for the dynamics of stock indices, commodity currencies, and Bitcoin.
Economic Calendar for the Week of November 9–13
The week of November 9–13 will test how justified current investor expectations are after the sharp decline in tech stocks. US inflation will set the nearest benchmarks for interest rates, AI company reports will allow assessing the financial return on infrastructure investments, and statistics from China and Europe will show the state of global demand.
For financial markets, the decisive factor will not be the individual value of CPI or quarterly profit, but the consistency of incoming signals. A slowdown in inflation with sustained economic activity can support the recovery of risk assets. However, persistent price pressure, weak company forecasts, and deteriorating demand may prolong the period of increased volatility.
Therefore, it is important for investors to assess the week's events in a comprehensive manner — through changes in interest rate expectations, bond yields, dollar dynamics, and the reaction of stock and cryptocurrency markets.